Learn Python with Fantasy Football - Projecting Kicker Performance
Learn how to use Python to project kicker performance.
Learn how to use Python to project kicker performance.
If you have any questions about the code here, feel free to reach out to me on Twitter or on Reddit.
If you like Fantasy Football and have an interest in learning how to code, check out our Ultimate Guide on Learning Python with Fantasy Football Online Course. Here is a link to purchase for 15% off. The course includes 15 chapters of material, 14 hours of video, hundreds of data sets, lifetime updates, and a Slack channel invite to join the Fantasy Football with Python community.
In this post, I'm going to take you down a bona fide rabbit hole of projecting kicker points for week 6 of the NFL season. I'm not proud of taking 2 hours out of my day to come up with this code, considering I already have Will Lutz on my roster, but once I realized I spent too much time projecting kicker fantasy points, I was already too deep in. Here it is in all it's shame and glory.
First, we are going to pull 2020 play by play data courtesy of nflfastR to find two things - how many 0-39 yard field goals, 40 - 49 yard field goals, 50+ field goals and extra points each team is allowing per game. We're also going to find where offenses are kicking these same categories of field goals. We're then going to join these two DataFrames based off who's playing who in week 6. From there, we're just going to average the results. For example, if CAR is playing ATL, and CAR is giving up 3 field goals a game between the 0 and 39 yard line, and ATL is kicking 2 field goals a game in the 0 and 39 yard line, then we'll say ATL is going to kick 2.5 field goals (what's a 0.5 of a field goal amirite).
Once we get that done, we're going to automate finding the starting kickers for each team. We're going to find those kickers that have the most attempts for their teams, and call them the starting kickers. There's some problems here, namely injuries and kickers losing their starting jobs. A kicker could have the most attempts for their teams but also not be the starting kicker. The only solution for this, as far as I can tell, is to manually input the starting kickers for each team in to pandas. I chose not to do that, and the kicker list we come up with looks fine to me, but you can input them manually to be safe.
Once we get the starting kickers for each team, we are going to then pull their historical %s from within the 39, 40-49, 50+ and also extra points. We're then going to multiply their historical % by the expected kicks within each "bin" we calculated above, and then multiply by the appropriate scoring weights (3 for 30-39 yard field goal, 4 for 40-49 yard field goal, 5 for 50+ and 1 for xp).
One problem I don't have a great solution for is the question of missed kicks. Most leagues deduct a point for each missed kick. To account for this, we're going to calculate a cumulative missed kick percentage. If that number is over 50%, meaning it's more than likely, we'll say the kicker will miss one field goal in the game and needs to be deducted a point. Not the best solution, but these are not robust projections.
This is going to require some serious data munging and manipulation, and hopefully by the end of this post you'll (a) maybe find one of these top kickers sitting on your waivers and pick them up for week 6 and (b) be a lot more comfortable with pandas.
Let's start out by importing pandas. This will be the only library we'll need for this monstrosity.
Next, let's load in our 2020 play by play data. This contains every play for the 2020 season thus far.
This giant block of code below is grabbing plays that were either field goals or extra points, binning them for both defenses and offenses, and then merging them together and averaging them out for a projected kicks in each bin number for each team.
| posteam | 0-39 yards | 40-49 yards | 50+ yards | extra_point | fantasy_points_up_for_grabs | |
|---|---|---|---|---|---|---|
| 13 | IND | 2.2 | 1.0 | 0.3 | 2.0 | 14.1 |
| 2 | CAR | 2.6 | 0.7 | 0.2 | 1.6 | 13.2 |
| 7 | ATL | 1.8 | 0.9 | 0.4 | 2.1 | 13.1 |
| 10 | TEN | 1.5 | 0.6 | 0.5 | 2.6 | 12.0 |
| 17 | KC | 1.3 | 0.7 | 0.4 | 3.1 | 11.8 |
| 25 | MIA | 1.5 | 1.1 | 0.2 | 1.7 | 11.6 |
| 5 | ARI | 1.0 | 0.7 | 0.5 | 3.0 | 11.3 |
| 1 | LA | 1.4 | 0.6 | 0.4 | 2.4 | 11.0 |
| 19 | NYG | 1.3 | 0.6 | 0.5 | 2.0 | 10.8 |
| 11 | DET | 1.6 | 0.4 | 0.3 | 2.5 | 10.4 |
| 14 | NYJ | 1.4 | 0.7 | 0.3 | 1.8 | 10.3 |
| 20 | BAL | 1.1 | 0.8 | 0.1 | 3.3 | 10.3 |
| 18 | LAC | 0.8 | 0.7 | 0.4 | 2.6 | 9.8 |
| 22 | WAS | 1.3 | 0.5 | 0.3 | 2.1 | 9.5 |
| 0 | DAL | 1.5 | 0.4 | 0.2 | 2.2 | 9.3 |
| 24 | GB | 0.8 | 0.6 | 0.3 | 2.9 | 9.2 |
| 23 | MIN | 0.9 | 0.7 | 0.2 | 2.7 | 9.2 |
| 12 | CIN | 1.3 | 0.8 | 0.0 | 1.6 | 8.7 |
| 8 | TB | 1.3 | 0.4 | 0.2 | 2.2 | 8.7 |
| 3 | JAX | 1.1 | 0.6 | 0.1 | 2.4 | 8.6 |
| 9 | BUF | 1.1 | 0.5 | 0.1 | 2.7 | 8.5 |
| 15 | CHI | 0.9 | 0.5 | 0.2 | 2.3 | 8.0 |
| 6 | SF | 1.0 | 0.2 | 0.4 | 2.2 | 8.0 |
| 21 | CLE | 0.7 | 0.5 | 0.2 | 2.5 | 7.6 |
| 4 | PIT | 1.1 | 0.4 | 0.0 | 2.6 | 7.5 |
| 26 | HOU | 0.7 | 0.7 | 0.1 | 2.0 | 7.4 |
| 16 | DEN | 0.8 | 0.2 | 0.4 | 1.7 | 6.9 |
We now have our expected kicks allowed within the 0-39, 40, 50+ and xps for each team for week 6. Whew. Let's run the process where we try to find starting kickers based off total volume of kicks. Remember, if a player has the most attempted kicks for a given team, they are considered the starting kicker for the team. This is not a perfect solution, and prone to errors, but it's automated. If you want to be sure, just input them manually, although that could take a while.
| posteam | kicker_player_id | kicker_player_name | field_goal_attempt | |
|---|---|---|---|---|
| 0 | ARI | 32013030-2d30-3033-3338-36325773133e | Z.Gonzalez | 8 |
| 1 | ATL | 32013030-2d30-3033-3337-30326977ce14 | Y.Koo | 12 |
| 2 | BAL | 32013030-2d30-3032-3935-39371b9a6ac1 | J.Tucker | 11 |
| 3 | BUF | 32013030-2d30-3033-3631-3632acada4b4 | T.Bass | 7 |
| 4 | CAR | 32013030-2d30-3033-3531-3932216f9967 | J.Slye | 14 |
Awesome, so now what we need to do is find each kickers accuracy within the 0-39, 40-49, etc. We're going to do this for the past 4 years, although you can change it to the past 5. Recall that the extra point distance was changed in 2015, though, so that may affect things.
To start out, we're going to calculate the accuracy % for each of these bins for all players in this 2016 - 2020 time span. The code block below is going to look a lot like the code block where we find each kickers accuracy % within our kickers_df.
| makes | misses | total | %make | |
|---|---|---|---|---|
| 0-39 yards | 2356 | 157 | 2513 | 0.937525 |
| 40-49 yards | 1036 | 332 | 1368 | 0.757310 |
| 50+ yards | 330 | 221 | 551 | 0.598911 |
| extra_point | 5065 | 326 | 5391 | 0.939529 |
Surprisingly, kicks from 50+ yards are almost at 60%. I personally thought that number would be lower.
Now, let's look at our kickers_df and try to calculate these same numbers for each individual kicker.
| kicker_player_id | 0-39% | 40-49% | 50+% | xp% | |
|---|---|---|---|---|---|
| 0 | 32013030-2d30-3032-3332-3532f5449f53 | 0.962500 | 0.902439 | 0.583333 | 0.945578 |
| 1 | 32013030-2d30-3032-3338-35338ddfcccf | 0.961290 | 0.827160 | 0.690476 | 0.959596 |
| 2 | 32013030-2d30-3032-3433-3333989a5c75 | 0.963115 | 0.775000 | 0.696429 | 0.946215 |
| 3 | 32013030-2d30-3032-3535-3635a053aabb | 0.958478 | 0.751825 | 0.661290 | 0.942959 |
| 4 | 32013030-2d30-3032-3535-3830b71d2a71 | 0.952909 | 0.761628 | 0.649351 | 0.945551 |
Awesome, all that's left to do is merge this individual kicker completion percentage with the fg_df and the kickers_df, and then calculate an expected value for fantasy points.
Below, we calculate projected fantasy points. Remember that we have to account for missed kicks as well. If a player's cumualtive miss % is greater than 0.5, we see they are more than likely to miss a kick given their accuracy % and the volume of kicks they're expected to receive. We'll deduct 2 two points instead of 1, which is also not a perfect solution (We're deducting 2 instead of 1 because if a player misses a kick, it's a net loss of 2 points, as they lost the opportunity to gain a potential point for a kick and also were deducted a point. Again not a perfect solution because the potential loss of fantasy points can be greater than 1).
Finally, the last thing to do is sort our dataframe and check out the results.
| kicker_player_name | proj_fpts | |
|---|---|---|
| 4 | J.Slye | 11.668688 |
| 30 | S.Gostkowski | 10.395247 |
| 13 | R.Blankenship | 10.144535 |
| 19 | J.Sanders | 9.890799 |
| 10 | M.Prater | 9.372355 |
| 2 | J.Tucker | 9.137891 |
| 1 | Y.Koo | 9.122913 |
| 23 | G.Gano | 9.086607 |
| 24 | S.Ficken | 8.767405 |
| 8 | G.Zuerlein | 8.292877 |
| 31 | D.Hopkins | 8.205832 |
| 17 | M.Badgley | 8.106521 |
| 15 | H.Butker | 8.027771 |
| 20 | D.Bailey | 7.868137 |
| 11 | M.Crosby | 7.831012 |
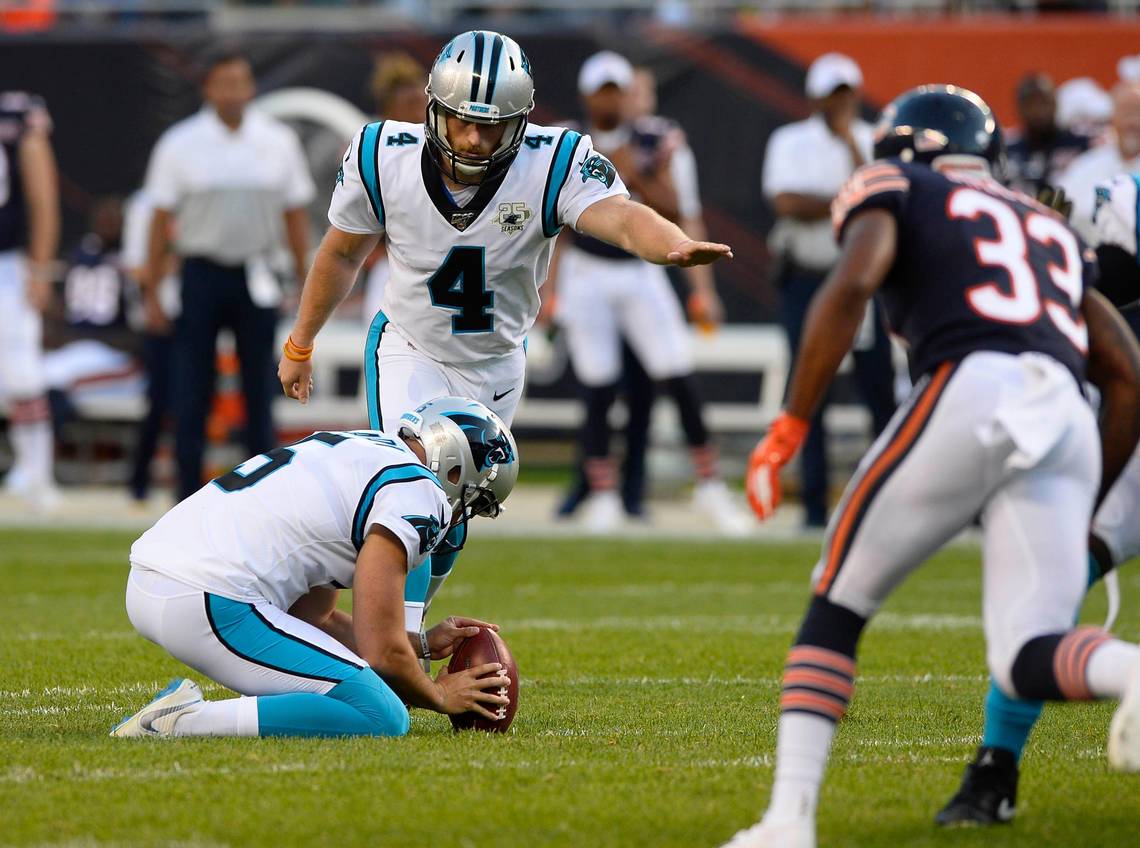
If you reached the end of this post, congrats and grab Joey Slye if he's still on your waivers. JK, he's probably not.
Thanks for reading! You guys are awesome.