A Value-Based Draft Model
In this part of the intermediate series, make a whole value based draft model with Python.
In this part of the intermediate series, make a whole value based draft model with Python.
If you have any questions about the code here, feel free to reach out to me on Twitter or on Reddit.
If you like Fantasy Football and have an interest in learning how to code, check out our Ultimate Guide on Learning Python with Fantasy Football Online Course. Here is a link to purchase for 15% off. The course includes 15 chapters of material, 14 hours of video, hundreds of data sets, lifetime updates, and a Slack channel invite to join the Fantasy Football with Python community.
In this post, I want to show you how you can build a draft model for 2020 using Python, Pandas, and some web scraping in no less than a couple hundred lines of code. I'll provide the source code in a github repo and you guys can make pull requests if you like.
I know I said I'd be working on other stuff for part 5 of the series in the last post, but I couldn't resist considering draft season is close away and the fact that I haven't posted for the intermediate series in so long. (Oops - sorry guys)
A couple things, first.
1 - We are going to be coming up with a draft model for a snake draft. I'm not super familiar with auctions and so we won't be focusing on them too much. Sorry.
2 - In order to get through this thing in one swoop, I'm going to gloss over some of the in-depth code explanations I usually give in my other posts. If you've made it this far, you should be able to keep up though. If not, stackoverflow is your friend!
3 - We are going to be calculating something known as value over replacement for each player in the draft pool, and then sort them in descending order. This will be the basis of our ranking model. To begin this post, we'll talk about what value over replacement is and why it's actually really effective and ranking players for the draft. If I decide to make this thing a series, we'll also include ADP data in our final DataFrame and look for gaps in ADP rank and VOR rank (the point of this is that we'll be looking for bargains/steals).
4 - This draft model works for the standard, half-ppr, and ppr formats. I'll be working in PPR as that's my main league format, but this code here can easily be extended to the other formats.
5 - We are going to be scraping the data from FantasyPros. Thanks FantasyPros (even though we didn't ask)! FantasyPros provides us two things that we need for our model - ADP data and projection. Moreover, the projection data hosted on Fantasypros is a combination of 4 different sources.
That's all the background info you need for now. Let's talk about VOR, what it is, and why you should use it.
| A | B | |
|---|---|---|
| QB | 20 | 25 |
| RB | 19 | 11 |
| WR | 15 | 14 |
Let's take this simple example of two teams facing off - which we call team A and team B. There are only two teams in this fictional league and only 6 players in the draft pool - no other teams, no other players. Each team has one spot for QB, RB, and WR. The DataFrame here shows us how many points each position scored for each team. Let's do two things, let's see which team won, first of all. And let's also look at the point differential for each position.
So, A won with a win margin of 4 points.
| A | B | A - B | |
|---|---|---|---|
| QB | 20 | 25 | -5 |
| RB | 19 | 11 | 8 |
| WR | 15 | 14 | 1 |
So, here we have the altered our original df to include the score differential. We can see that A's RB provided the largest score differential for team A.
We also calculated the max for each row, and we can see that B's QB topped the list.
This is at the heart of VOR. B's QB scored the most points, but was he the most valuable player?
Not exactly. The most valuable player was actually A's RB, as he provided the largest differential.
You see, you have a limited amount of spots on your starting to play your players. And your opponent also has a limited number of starting roster spots to play their players. And so the goal of fantasy football is not to maximize how many points you'll score, but maximize your scoring differential at each position in relation to your opponent.
If the goal of FF was to maximize your points scored, then we'd all be picking QB's early in the draft. But we're all smart enough so that this doesn't happen. Why? Because there's few QB's that provide a large enough differential compared to their peers to justify drafting them so high. In contrast, RB's are more spread out, and so if you miss out on a stud RB in the early rounds, you may be hard pressed to find a RB in later rounds who can provide that same differential. In short, RB's have higher positional value, and as we'll see, higher replacement values. For QBs, you can just pick up Matt Stafford in the 10th round, and you would've only been slightly better off if you went Russell Wilson in the 7th. The same can't be said if you don't draft Mark Ingram in the 7th round and go for Damien Williams in the 10th.
You can think of these scoring differentials as our value over replacement numbers. Each player's value is the differential they can provide over a typical replacement player. In the universe we constructed, though, we only have 2 teams and 6 players. And thus, calculating VOR is as simple as the following:
And there's our ranking model (for this universe)! If you were to go back in time and redraft, you would want to pick A's RB 1st, B's QB 2nd, and A's WR 3rd. The point here is that you wouldn't go B's QB 1st, even though he scored the highest points.
Extending this to a 12 team league with a 196 player draft pool and large waiver wire and calulating a value over replacement value is much more difficult, and thus we need to rely on estimates of replacement value instead.
What we have to do is find a "replacement player" for each position in the draft pool - a player who's projected points represents the average postional value at each position. Then, with respect to each player's position (this is important. You want to compare each player's projected points to their position's replacement value), substract out the replacement value you calculated from your replacement player. The value you're left with is each player's value over the typical replacement player, or for short, their value over replacement.
There's multiple ways people do this, but I've found the most reliable method is to do the following:
1 - Look at ADP for the upcoming draft year and look at pick #100.
2 - Starting from pick 100, go backwards and look for the last WR, RB, QB, and TE picked thus far. These players are your replacement players.
Other methods include using "man games" (which, in my opinion, is a bit too convulated for my taste, although it is an interesting idea), picking the average starter, and picking the worst average starter. I've found the "point in draft" method I layed out above works the best. The decision to use pick #100 is relatively arbitrary, but it's what most FF-experts use, so we'll roll with it. You can also use several cutoff points, and then average the results you get from a range in say, [75, 125], and then use that as your model. I actually don't think that's a bad idea, but we'll just be using 100 for the sake of brevity. You can adjust the cutoff point based on your league size. 100 works well for leagues in the 10-12 team range, but if you have a 16 team league for example, maybe move that up to 115.
Hopefully, that all makes sense.
With the theory out of the way, let's code. Our first step is to find our replacement players. We'll find this using ADP data provided by FantasyPros. We have to scrape this data. Like I said, we'll be working with PPR data (ADP obviously changes for each format), but this can easily be extended to half PPR and standard.
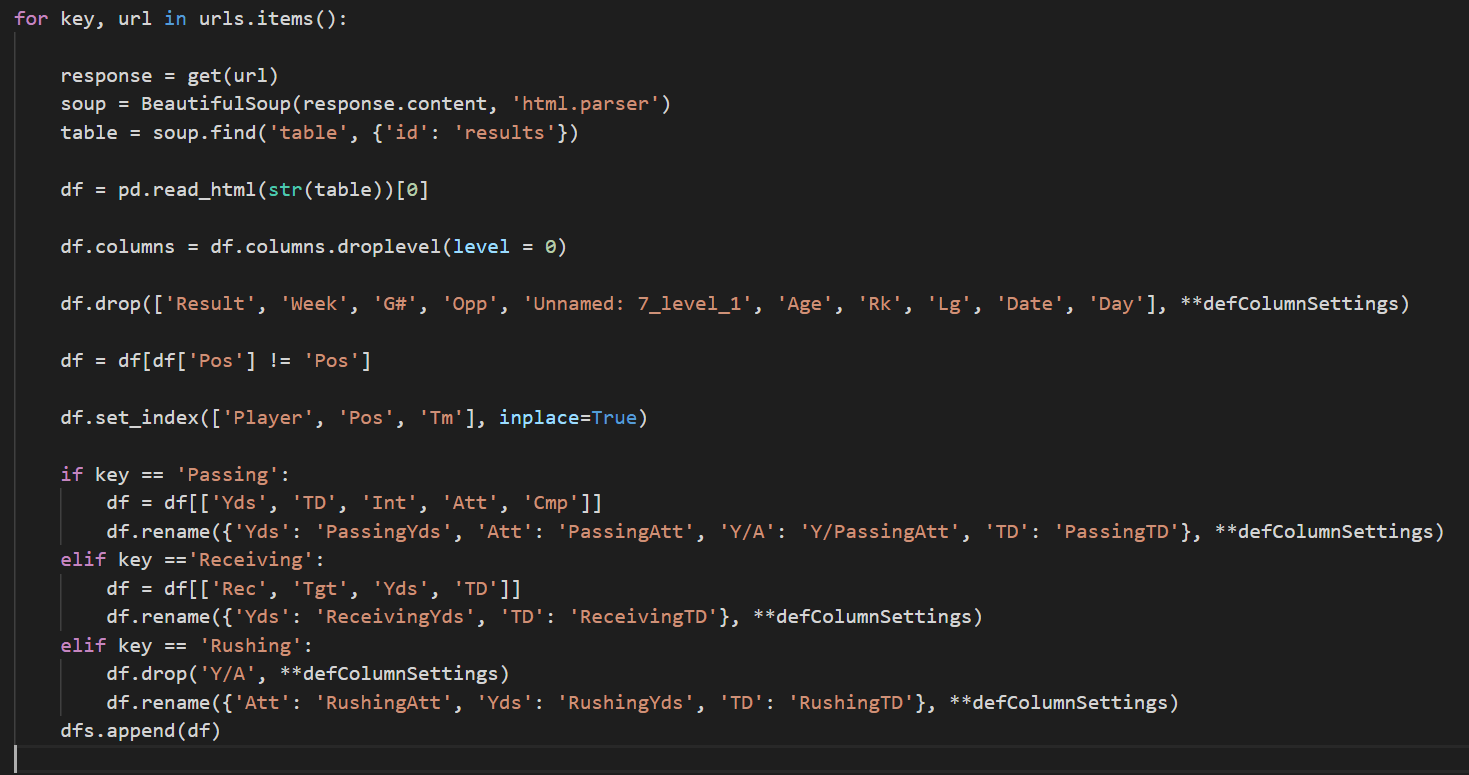
We wrote a little function called make_adp_df that makes a request to the URL stored in the BASE_URL variable. If you inspect element on the page, you'll find the data we need is hidden in a table tag with an id of 'data'. If you want to use a different format, go to that URL and toggle the drop down list to your league format. The URL will change, and that will be the URL you will use in your function.
I included print statements along the way to visualize the changes I was making to the dataframe as we made them. What we are left with is that df under 'Final output', which is all we need.
What we need now is to cutoff our df at 100, and find the last RB, QB, TE, and WR chosen up to that point (on average), and append them to a dictionary we'll call replacement_players.
That was pretty easy actually. All we did here was continously updated our dictionary until we reached the end of our loop. The last player at each position is the one that stays in our replacement_values dictionary.
Now that we have our replacement players, we have to get projection data. We're going to scrape PPR projection data from FantasyPros, and then replace the player name values in our dicitonary with their projected points.
| PLAYER | POS | FPTS | |
|---|---|---|---|
| 0 | Christian McCaffrey | RB | 366.5 |
| 0 | Lamar Jackson | QB | 355.4 |
| 1 | Patrick Mahomes | QB | 342.0 |
| 0 | Michael Thomas | WR | 326.4 |
| 2 | Dak Prescott | QB | 314.1 |
Cool, so now we have a dataframe with projected player points straight from fantasy pros. I've added comments throughout the code so we can move on with life faster (at least I can).
So we have replacement players, we have projected points, what's left to do now is calculate our replacement values for each position from our replacement_players dictionary, and then calculate a new column for our final df called VOR, and sort that table in descending order.
So now we have our replacement values based on the df we just calculated above. To reiterate, these replacement values are what's going to be substracted from each player's projected FPTS, WITH RESPECT TO THEIR POSITION. I can't emphasize that enough. The real value, pun not intended, in a value over replacement model is the ability to compare players at different positions with different projected points. The answer to that question is not trivial and is usually left to intuition. But this Fantasy Football Data Pros damnit, to hell with intuition.
| PLAYER | POS | FPTS | VOR | |
|---|---|---|---|---|
| 0 | Christian McCaffrey | RB | 366.5 | 214.5 |
| 0 | Lamar Jackson | QB | 355.4 | 81.5 |
| 1 | Patrick Mahomes | QB | 342.0 | 68.1 |
| 0 | Michael Thomas | WR | 326.4 | 161.3 |
| 2 | Dak Prescott | QB | 314.1 | 40.2 |
And in one line of code, we've done it! Let's sort our dataframe on VOR and look at our top ranked players.
| PLAYER | POS | FPTS | VOR | VALUERANK | |
|---|---|---|---|---|---|
| 0 | Christian McCaffrey | RB | 366.5 | 214.5 | 1.0 |
| 0 | Michael Thomas | WR | 326.4 | 161.3 | 2.0 |
| 1 | Saquon Barkley | RB | 305.9 | 153.9 | 3.0 |
| 2 | Ezekiel Elliott | RB | 299.3 | 147.3 | 4.0 |
| 5 | Alvin Kamara | RB | 294.9 | 142.9 | 5.0 |
| 4 | Dalvin Cook | RB | 289.4 | 137.4 | 6.0 |
| 1 | Davante Adams | WR | 289.2 | 124.1 | 7.0 |
| 2 | Julio Jones | WR | 279.7 | 114.6 | 8.0 |
| 0 | Travis Kelce | TE | 254.2 | 107.5 | 9.0 |
| 3 | Derrick Henry | RB | 259.1 | 107.1 | 10.0 |
| 7 | Clyde Edwards-Helaire | RB | 249.6 | 97.6 | 11.0 |
| 8 | Miles Sanders | RB | 249.5 | 97.5 | 12.0 |
| 14 | Austin Ekeler | RB | 248.4 | 96.4 | 13.0 |
| 5 | DeAndre Hopkins | WR | 260.0 | 94.9 | 14.0 |
| 12 | Kenyan Drake | RB | 245.6 | 93.6 | 15.0 |
| 3 | Tyreek Hill | WR | 257.3 | 92.2 | 16.0 |
| 10 | Aaron Jones | RB | 240.9 | 88.9 | 17.0 |
| 1 | George Kittle | TE | 233.5 | 86.8 | 18.0 |
| 9 | Joe Mixon | RB | 237.5 | 85.5 | 19.0 |
| 4 | Chris Godwin | WR | 250.4 | 85.3 | 20.0 |
| 0 | Lamar Jackson | QB | 355.4 | 81.5 | 21.0 |
| 6 | Nick Chubb | RB | 227.4 | 75.4 | 22.0 |
| 8 | D.J. Moore | WR | 238.8 | 73.7 | 23.0 |
| 12 | Robert Woods | WR | 237.8 | 72.7 | 24.0 |
| 6 | Mike Evans | WR | 237.6 | 72.5 | 25.0 |
| 18 | Le'Veon Bell | RB | 223.9 | 71.9 | 26.0 |
| 11 | Josh Jacobs | RB | 223.6 | 71.6 | 27.0 |
| 17 | Leonard Fournette | RB | 222.2 | 70.2 | 28.0 |
| 7 | Kenny Golladay | WR | 234.3 | 69.2 | 29.0 |
| 15 | Cooper Kupp | WR | 233.8 | 68.7 | 30.0 |
| 1 | Patrick Mahomes | QB | 342.0 | 68.1 | 31.0 |
| 16 | Allen Robinson | WR | 232.7 | 67.6 | 32.0 |
| 13 | Chris Carson | RB | 217.5 | 65.5 | 33.0 |
| 15 | Todd Gurley | RB | 217.1 | 65.1 | 34.0 |
| 9 | Adam Thielen | WR | 230.0 | 64.9 | 35.0 |
| 11 | Amari Cooper | WR | 229.1 | 64.0 | 36.0 |
| 14 | Calvin Ridley | WR | 228.4 | 63.3 | 37.0 |
| 3 | Zach Ertz | TE | 209.8 | 63.1 | 38.0 |
| 19 | Keenan Allen | WR | 226.7 | 61.6 | 39.0 |
| 16 | David Johnson | RB | 213.3 | 61.3 | 40.0 |
| 13 | Tyler Lockett | WR | 223.8 | 58.7 | 41.0 |
| 22 | JuJu Smith-Schuster | WR | 221.5 | 56.4 | 42.0 |
| 17 | Odell Beckham Jr. | WR | 220.9 | 55.8 | 43.0 |
| 19 | James Conner | RB | 206.3 | 54.3 | 44.0 |
| 20 | Melvin Gordon | RB | 205.9 | 53.9 | 45.0 |
| 10 | A.J. Brown | WR | 216.7 | 51.6 | 46.0 |
| 18 | DeVante Parker | WR | 214.5 | 49.4 | 47.0 |
| 20 | Courtland Sutton | WR | 212.7 | 47.6 | 48.0 |
| 21 | Terry McLaurin | WR | 211.7 | 46.6 | 49.0 |
| 24 | T.Y. Hilton | WR | 209.3 | 44.2 | 50.0 |
| 4 | Darren Waller | TE | 190.2 | 43.5 | 51.0 |
| 2 | Mark Andrews | TE | 189.9 | 43.2 | 52.0 |
| 27 | Jarvis Landry | WR | 205.9 | 40.8 | 53.0 |
| 2 | Dak Prescott | QB | 314.1 | 40.2 | 54.0 |
| 3 | Deshaun Watson | QB | 312.1 | 38.2 | 55.0 |
| 23 | D.K. Metcalf | WR | 203.2 | 38.1 | 56.0 |
| 26 | Stefon Diggs | WR | 201.6 | 36.5 | 57.0 |
| 28 | A.J. Green | WR | 201.5 | 36.4 | 58.0 |
| 30 | D.J. Chark | WR | 201.4 | 36.3 | 59.0 |
| 25 | Michael Gallup | WR | 199.5 | 34.4 | 60.5 |
| 32 | Tyler Boyd | WR | 199.5 | 34.4 | 60.5 |
| 33 | Julian Edelman | WR | 198.0 | 32.9 | 62.0 |
| 29 | Marquise Brown | WR | 196.1 | 31.0 | 63.0 |
| 4 | Russell Wilson | QB | 304.1 | 30.2 | 64.0 |
| 25 | Devin Singletary | RB | 180.7 | 28.7 | 65.0 |
| 31 | Marvin Jones | WR | 188.8 | 23.7 | 66.0 |
| 24 | Ronald Jones II | RB | 175.4 | 23.4 | 68.0 |
| 36 | Jamison Crowder | WR | 188.5 | 23.4 | 68.0 |
| 29 | Kareem Hunt | RB | 175.4 | 23.4 | 68.0 |
| 5 | Evan Engram | TE | 168.0 | 21.3 | 70.0 |
| 5 | Kyler Murray | QB | 294.9 | 21.0 | 71.0 |
| 21 | Mark Ingram II | RB | 172.0 | 20.0 | 72.0 |
| 22 | David Montgomery | RB | 169.1 | 17.1 | 73.0 |
| 37 | Diontae Johnson | WR | 182.1 | 17.0 | 74.0 |
| 6 | Josh Allen | QB | 290.9 | 17.0 | 75.0 |
| 38 | Tarik Cohen | RB | 168.7 | 16.7 | 76.0 |
| 23 | Jonathan Taylor | RB | 168.1 | 16.1 | 77.5 |
| 38 | Christian Kirk | WR | 181.2 | 16.1 | 77.5 |
| 35 | James White | RB | 167.2 | 15.2 | 79.0 |
| 41 | Sterling Shepard | WR | 179.9 | 14.8 | 80.0 |
| 8 | Tyler Higbee | TE | 161.0 | 14.3 | 81.0 |
| 27 | D'Andre Swift | RB | 165.4 | 13.4 | 82.0 |
| 7 | Matt Ryan | QB | 286.7 | 12.8 | 83.0 |
| 34 | Will Fuller | WR | 177.1 | 12.0 | 84.0 |
| 6 | Hunter Henry | TE | 158.6 | 11.9 | 85.0 |
| 35 | Brandin Cooks | WR | 176.9 | 11.8 | 86.0 |
| 39 | Preston Williams | WR | 174.3 | 9.2 | 87.0 |
| 44 | Golden Tate | WR | 174.0 | 8.9 | 88.0 |
| 26 | Raheem Mostert | RB | 159.3 | 7.3 | 89.0 |
| 28 | Cam Akers | RB | 156.5 | 4.5 | 90.0 |
| 8 | Tom Brady | QB | 278.0 | 4.1 | 91.0 |
| 9 | Drew Brees | QB | 275.9 | 2.0 | 92.0 |
| 11 | Hayden Hurst | TE | 147.0 | 0.3 | 93.0 |
| 7 | Jared Cook | TE | 146.7 | 0.0 | 95.5 |
| 30 | Kerryon Johnson | RB | 152.0 | 0.0 | 95.5 |
| 40 | John Brown | WR | 165.1 | 0.0 | 95.5 |
| 10 | Aaron Rodgers | QB | 273.9 | 0.0 | 95.5 |
| 42 | Deebo Samuel | WR | 164.0 | -1.1 | 98.0 |
| 11 | Carson Wentz | QB | 270.3 | -3.6 | 99.0 |
| 13 | Mike Gesicki | TE | 142.6 | -4.1 | 100.0 |
You now have a draft model completely built in less than (I think) 100 lines of Python. This would've taken me like 4 hours in excel, and I can only imagine the INDEX and MATCH formulas I'd have to use (I'm getting a headache just thinking about it).
I'll leave it up to you to interpret the results. I ran this same model through a FantasyPros mock draft and got a score of 93, for whatever that's worth.
In the next post, I think we'll come back to joining tables (like I promised in part 4) and join ADP data and this model here. We'll then look for gaps in ADP and our ranking model and try to find those players who are sleepers, and those players who are overvalued.
Thanks for reading, you guys are awesome.
READ NEXT
The Complete Value-Based Draft Model