Learn Python with Fantasy Football - In Depth Rushing Analysis
Learn how to use Python to find those player's with the highest quality rushing attempts.
Learn how to use Python to find those player's with the highest quality rushing attempts.
If you have any questions about the code here, feel free to reach out to me on Twitter or on Reddit.
If you like Fantasy Football and have an interest in learning how to code, check out our Ultimate Guide on Learning Python with Fantasy Football Online Course. Here is a link to purchase for 15% off. The course includes 15 chapters of material, 14 hours of video, hundreds of data sets, lifetime updates, and a Slack channel invite to join the Fantasy Football with Python community.
In this post, we create a visualization using matplotlib and pandas to find where some notable RB's have been getting their carries through two weeks in to the 2020 season (how far away from the endzone). For each player with over 10 rushing attempts, we are going to be counting the number of times they ran the ball in the 0 - 10 yardline zone, 11 - 20 yardline zone, 21 - 30, 31 - 40, 41 - 60, 61 - 80, 81 and on. We're looking for those player's who have a large amount of their carries in those high TD percentage areas like the upper half of the redzone.
Before we start, as always, load up Google Colab and create a new notebook. Let's import some libraries we'll be using throughout the notebook in the first cell.
We're going to run through the code here fairly quickly. If you feel like this code may be a bit too advanced for you, you should check out our course on learning Python with Fantasy Football from scratch. That's a link for 15% off. All of the material in the course is aimed at getting you to learn coding through something you enjoy - fantasy football. It comes with 15 sections of material, 14 hours of video, a course slack channel to ask questions where you get stuck, and lifetime access and updates.
We are going to be working with 2020 play by play data to find each player's rushes for the 2020 season. All we need for each play is a play description, whether or not a play was a rush, and the distance from the endzone. Luckily, this data is available to us via nflfastR. Go ahead and download the 2020 play by play data from that link. That's the play_by_play_2020.csv file we load in with pandas below.
| yardline_100 | rush_attempt | rusher_player_id | rusher_player_name | |
|---|---|---|---|---|
| 3 | 55.0 | 1.0 | 32013030-2d30-3033-3136-3837aa36ac48 | R.Mostert |
| 4 | 41.0 | 1.0 | 32013030-2d30-3033-3136-3837aa36ac48 | R.Mostert |
| 5 | 39.0 | 1.0 | 32013030-2d30-3033-3136-3837aa36ac48 | R.Mostert |
| 23 | 64.0 | 1.0 | 32013030-2d30-3033-3136-3837aa36ac48 | R.Mostert |
| 33 | 78.0 | 1.0 | 32013030-2d30-3033-3331-31385a388006 | K.Drake |
We're isolating that player_id_table so we can use it later in the code to look up a player's name in this table later. In a moment, we'll be grouping by rusher_player_id and then binning each RB's carries. Once we have the bins, we can just look up each player's name with that table. This ensures that we don't mix up players, as each player's rusher_player_id is unique.
Now what we're going to be doing is going through each player and essentially "binning" all of their rushing attempts in to the bins we instantiate below in the new_df_data dictionary which will be the source for our new DataFrame. The numbers that go in to the bins are the proportion of a player's rushing attempts that belong to that "zone". For example, if a player has 20 rushing attempts through week 2 and 5 came from within the 10 yard line, then 5/20 would be the number that gets append to the 1 - 10 yardline list.
| 1 - 10 yardline | 11 - 20 yardline | 21 - 30 yardline | 31 - 40 yardline | 41 - 60 yardline | 61 - 80 yardline | 81 - 100 yardline | |
|---|---|---|---|---|---|---|---|
| rusher_player_name | |||||||
| R.Mostert | 0.043478 | 0.043478 | 0.130435 | 0.086957 | 0.217391 | 0.347826 | 0.130435 |
| K.Drake | 0.055556 | 0.083333 | 0.138889 | 0.055556 | 0.083333 | 0.388889 | 0.194444 |
| K.Murray | 0.047619 | 0.142857 | 0.095238 | 0.142857 | 0.190476 | 0.238095 | 0.142857 |
| T.Coleman | 0.055556 | 0.000000 | 0.000000 | 0.222222 | 0.388889 | 0.333333 | 0.000000 |
| D.Montgomery | 0.000000 | 0.000000 | 0.000000 | 0.241379 | 0.344828 | 0.344828 | 0.068966 |
Let's filter our DataFrame based off the index to only include notable players. I'm excluding in this list (I probably missed a couple players, oh well) QBs and those player's who are injured for the next couple weeks or season as a result of Week 2 (Saquon and CMC).
Finally, we can use df.plot.barh to plot a horizontal stacked bar plot. We can do this in a single line of code, and then use matplotlib to help us style and set the figure size and title.
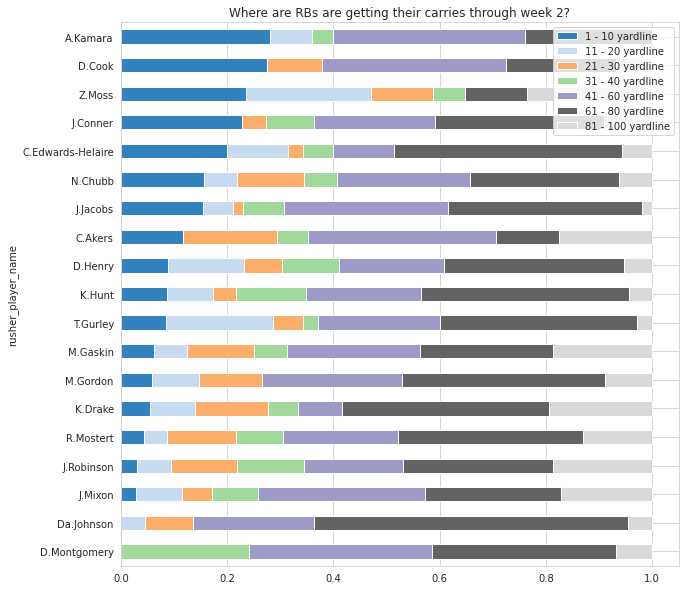
And that's our visualization!
As we can see, Alvin Kamara is poised to have a great year. If he stays healthy, at this rate I think he finishes RB1 on the season.
Zach Moss has a huge volume of carries in the redzone, more than any other player, but also no rushing touchdowns on the season.
David Montgomery is yet to have a single redzone touch. I found this hard to believe, but I went back and double checked his plays and yup, 0 redzone touches through 2 weeks.
Thanks for reading! Good luck in week 3!