Statistical Analysis of Aaron Jones' 2019 Fantasy Football Season using Python
Ben Dominguez2020-05-1630 minute read
In this post, we take a look at Aaron Jones' 2019 Fantasy Football season. We look at the correlation between his output and Jamaal Williams' usage, how Jones' did compared to other top tier RBs, and whether or not he is primed for regression in 2020.
If you have any questions about the code here, feel free to reach out to me on Twitter or on Reddit.
If you like Fantasy Football and have an interest in learning how to code, check out our
Ultimate Guide on Learning Python with Fantasy Football Online Course. Here is a link to purchase for
15% off. The course includes 15 chapters of material, 14 hours of video, hundreds of data sets, lifetime
updates, and a Slack channel invite to join the Fantasy Football with Python community.
What We'll Be Doing in This Post
Anyway, in this post, we are going to do a statistical deep-dive into Aaron Jones 2019 Fantasy Football season.
Aaron Jones finished as RB2 on the season, and if you had in your lineup (as I did) you'd know it was quite the
rollercoaster of a season. Let's do some stats and try to analyze his performance.
In this post, we'll be examining three questions:
1. How did Aaron Jones compare to other top tier RBs?
We know Jones finished #2 on the season in terms of total RB points, but total points scored does not tell the
whole picture. Scoring fantasy point is the name of the game, but we also want to look at how consistent Jones
was throughout the season and compare that to his
top-tier counterparts.
2. Did Jamaal Williams' involvement in the running game actually have an effect on Aaron Jones FF
performance?
Probably the most frustrating part of having Jones on my lineup this season, but did Williams really have an
effect on how Jones scored Fantasy Points week to week? I think the consensus amongst fantasy managers is yes -
but when looking the statistics the answer is a bit more nuanced. We'll be looking at Williams' usage numbers
and finding the correlation to Jones' output and using a p-value to examine the relationship's statistical
significance.
3. Based off his usage, did Aaron Jones over-perform his season and is he due for a regression in
touchdowns?
Another hot topic this year was how effective Aaron Jones was with his touches - of course, being too effective
with your touches might mean you got a bit lucky at times and are due for a regression in the next season.
So how do we tell if Jones over-performed his season? We'll be looking at play by play data for 2009 - 2018 and
building probability distributions for the likelihood of scoring a touchdown when a team is X yards away from
the endzone. We'll be doing this for both receiving and rushing touchdowns and then generating an expected TD
value for Aaron Jones based on 2019 play-by-play data. If Jones actual TDs are greater than his expected TD we
calculated, he may be due for a regression.
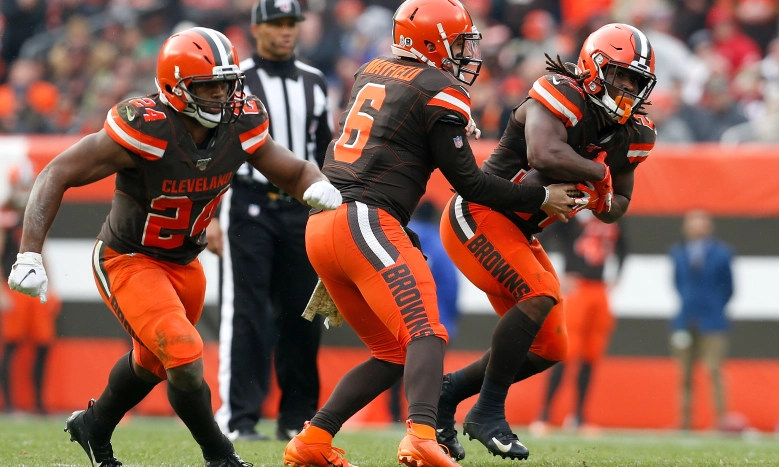
(Photo by Stacy Revere/Getty Images)
Load up your jupyer notebook and enter the following code in your first cell. By the way, if you're interested
in learning how to do this sort of analysis, check out my course on learning Python with Fantasy Football from
scratch. Here's a
discount link for 15% off.
In the next cell, let's create an empty DataFrame to start out, and iterate over a range containing
each number in a NFL season. Let's add a column to keep track of the weeks, and then concatenate these
DataFrames all together to get one big DataFrame containing 2019 data.
Let's get our top 5 PPR running backs for the 2019 season and confirm Aaron Jones is #2. I've included the
output in a comment.
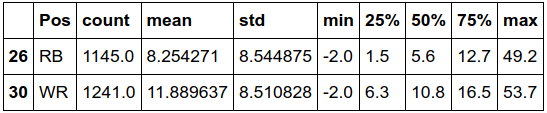
In the code block below, we groupby position, grab the FantasyPoints column and then use a df
method known as describe to get us back some descriptive statistics about running backs and wide
receivers for the 2019 season. Most meaningful here is the mean and std numbers.
Standard Deviation for RBs and WRs is about the same for both, but mean WR output was higher incidentally for
the 2019 season. This is most likely because these numbers are in PPR.
Question 1: How did Aaron Jones do in 2019 compared to other top-tier RBs?
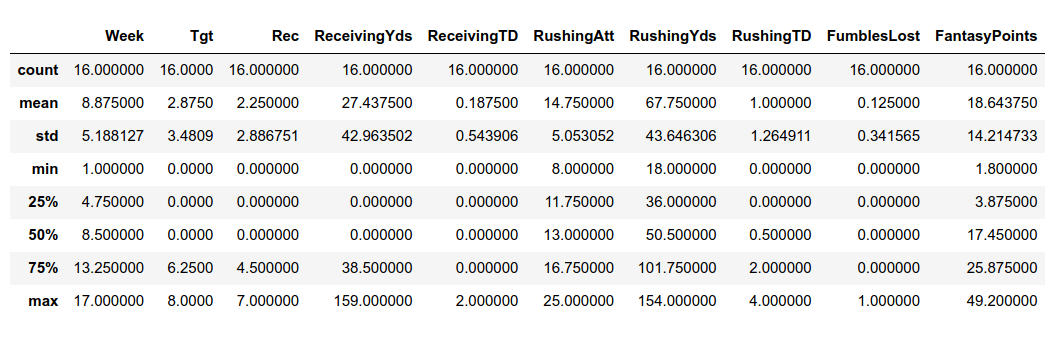
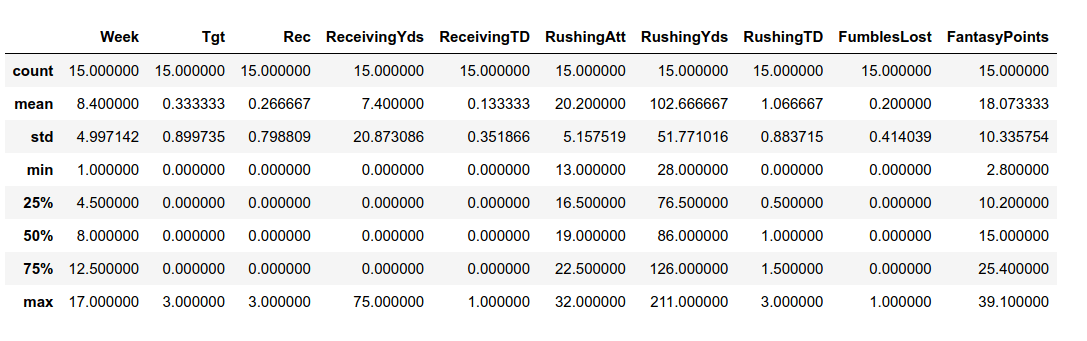
Let's actually take our DataFrame and group by player and get Aaron Jones, and describe his data using this
method.
And this is what we get as an output.
These are just regular statistics, but the one we should focus on here is standard deviation. For those who
don't know, standard deviation is a measure of dispersion. The higher the standard deviation, the more dispersed
our data. We want our FF players to have a low amount of dispersion, as this makes them more predictable week to
week.
Moving on, we want to look at std
of FantasyPoints here. It's about 14.214, which is quite high. One thing I want to emphasize throughout this
analysis
is that Fantasy Football output is not good enough when making FF decisions. We also want to consider how
consistent the player was in getting us Fantasy Football points each week. Let's look at Christian McCaffrey and
Derrick Henry, two other top RB's on the season and see how their standard deviation compared to Jones.
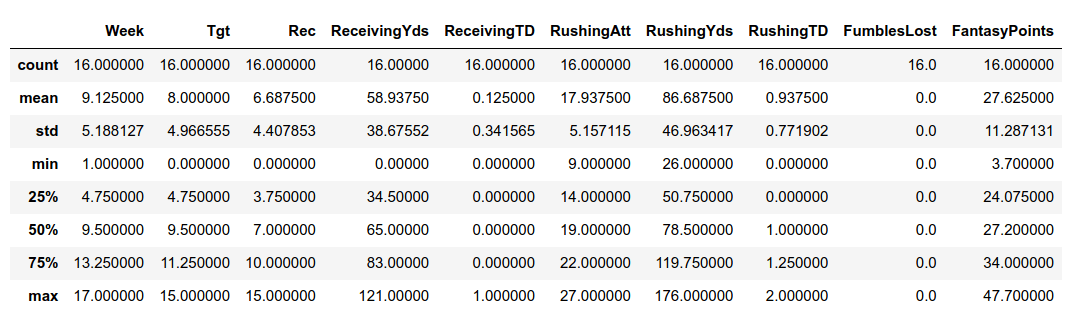
Generating descriptive stats for Mcc - output below.
MCC had a lower standard deviation and beat Aaron Jones by about 9 in mean Fantasy Points per game. MCC was a
beast this season, we all know this (trust me, I had to play the MCC owner like 3 times this season). Let's look
at Henry which makes the decision between Henry and Jones less clear cut.
Repeating the same process for Henry - and our output below.
So as expected, Henry has less Fantasy Points per game on the season (albeit not by much), but his standard
deviation is lower by about 4. That's big. That means that Henry was only a bit less effective than Jones in the
games he did play this season, but he was more consistent. When you look at the ratio of the standard deviation
to the mean (also known as the coefficient of variation), Jones has a much higher number. This made his season a
bit
more volatile. In general, I would say volatility is bad for Fantasy Football. You want players who you can
predict and consistently can get you points week in and week out.
These are fine examples, but let's see how Aaron Jones faired amongst all players in terms of his variation.
Aaron Jones finished second on the season in terms of standard deviation (no surprise Will Fuller is number one
on this list). I figured Aaron Jones would have a high standard deviation, which is why I chose to write about
him. I did not know he would be #2 on the season. Another way to (arguably, I'm sure I'll get some disagreement
on this) think of this was that Aaron Jones was the second least predictable player on the season.
Question 2: How did Jamaal Williams' Usage Affect Aaron Jones' Output on the Season?
Now let's see the correlation between Jamaal Williams' usage throughout the season and how that impacted Aaron
Jones' Fantasy Football performance. First, we need to grab Williams' stats from the data, and then, we want to
join the two tables together as Jamaal is missing some weeks. We only want to include those weeks that both
Williams and Jones both played, so we join the tables on the Week column and do a left join of the two
DataFrames, with Williams' table as the left table. (Doing a left join like this keeps the matching rows in the
left table, and drops the non-matching rows in the right table).
Let's define usage as rushing attempts + targets. I use targets instead of receptions as targets come before
receptions, always. Not the other way around. Therefore, they are probably a better indicator of overall
involvement in an offense.
From the scipy library, let's import a function called pearsonr which gives us back
both the correlation coefficient for two variables and also a p-value. A p-value tells us the probability of
committing a Type I Error.
Essentially, in stats we have a null-hypothesis - the world in it's current state
that we need to disprove using an alternate hypothesis. Our null hypothesis here is that there is no linear
relationship between Jamaal Williams and Aaron Jones' production. We need to disprove this null
hypothesis by
setting a significance level, which is the amount of probability of a Type I Error we are willing to accept. If
our p-value is less than the significance value, we can reject our null hypothesis and say that there is some
relationship between Jamaal Williams' usage and Aaron Jones' production.
We cannot reject the null-hypothesis here that there is no relationship between Williams' usage and Jones'
production. Take this insight with a grain of salt. Our p-value is close (some statisticians will argue this
does not matter - the decision to reject/accept based off a p-value is a binary decision, and a p-value of 0.051
shouldn't be differentiated from a p-value of 0.80), and we do have some negative correlation. It's just that
the correlation is not significant.
Question 3: Is Jones due for a regression in TD's?
As mentioned in the intro, we are going to be analyzing whether or not Aaron Jones over-performed his 2019
season based off the quality of his usage. The way we do this is by generating a probability distribution which
tells us the probability of scoring a receiving or rushing touchdown when a team is X yards away from the
endzone. We are then going to be using this model and turning around and looking at Aaron Jones' actual 2019
play-by-play data and come up with an expected TD number. If Jones' expected numbers exceeded his actual
numbers, he underperformed his season and is probably due for a positive regression in TDs in 2020. If his
actual number exceed his expected numbers, however, he is probably due for a negative regression.
First, let's generate a fresh DataFrame using the function we defined above and let's confirm that Aaron Jones
is indeed at the top of the list in terms of TDs.
Next, let's load in play-by-play data for 2009 to 2018 that we got from Kaggle. Here's the link to that. Beware: it's a large file at 700MB. you can see it takes about
20 seconds to load and has about 450,000 rows. I would not suggest setting low_memory=False. This
crashed my kernel a few times.
This function in the code block below here is the function that generates our probability distribution. It takes
in an output_variable, which is what we are calculating the probability of. Our output variables
here is going to be Passing TDs and Rushing TDs. It also takes in a filter_variable, which is how
we filter our play by play data. For passing TDs, for example, we only want those plays where a pass attempt
occurred. So we pass in passing_attempt. We pass in our data as our df we brought in just above,
and we use a smoothing_sigma to smooth out our distribution a bit.
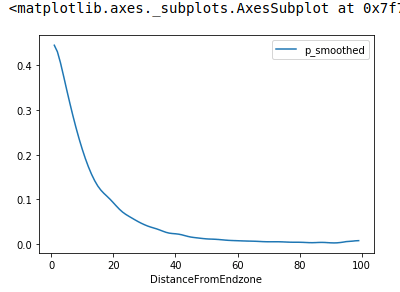
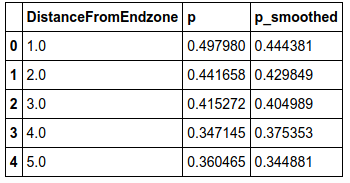
We've already written a lot of the code, so creating the distribution is as easy as the two lines below.
And output below.
The visualization is pretty self-explanatory. As we get further and further away from the goal line, the
probability of a passing TD decreases. As you can see below, at our opponents 1 yard line, we have a 44% chance
of scoring a passing touchdown. The output below is from running passing_df.head(), run
passing_df.tail() and you'll see that at our own one yard line, we have a very small chance of
scoring a passing TD.
We repeat the process for rushing touchdowns. We are going to be using these passing_df and
rushing_df vars later in our code. No need to plot the distribution again, they're very similar.
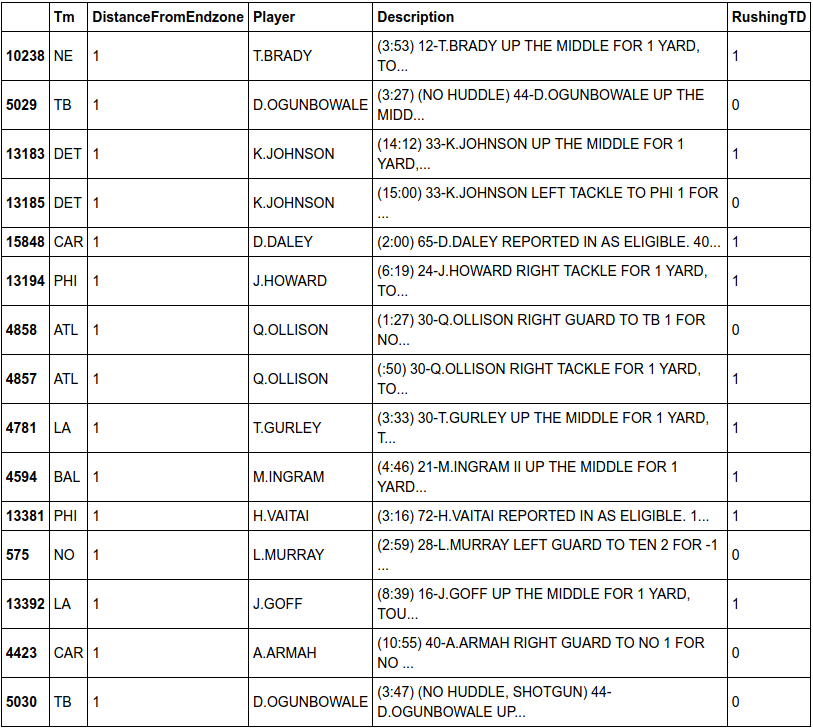
Now, we load in our 2019 pla yby play data. You can
find a link for that here. The problem with this data is that it comes from a different source (we don't
have 2019 play by play data from Kaggle), and the data is kinda messy. There is no player name columns so we're
going to have to do a fair bit of hacking to be able to take a play Description column and turn it
in to a player name column.
I don't want to delve too deep in to the code below as it doesn't relate directly to the topic of Aaron Jones
production this season. But essentially, we are turning this play Description column in to a player
name column we can use in our analysis.
And our output below -
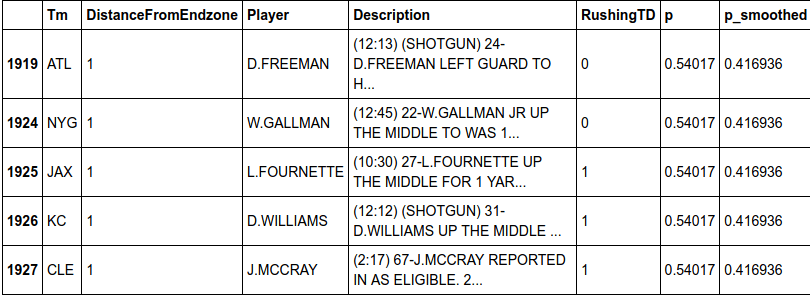
Now our data is pretty much formatted at this point. We've removed unnecessary columns and should have only
rushing plays. We now want to merge our data with the rushing_df we created earlier to add in what
the probability was of scoring a touchdown for each play based off the distribution we came up with previously.
Now we can see each play has a corresponding column that tells us the probability of a touchdown having occurred
on that play based off the yard line.
Let's calculate expected touchdowns by summing these probabilities.
Based off our model, Aaron Jones should have scored about 7 rushing touchdowns this season. Let's sort our model
by Expected Touchdowns to get a feel for how conservative/liberal our model was with making projections.
We can see that Aaron Jones finished 10th in our model when looking at expected touchdowns. This alone could
mean that he's due for some sort of regression next season. Interestingly, Nick Chubb, based off our model,
might be due for positive regression. He also leads the list in expected touchdowns meaning he got a lot of
quality touches this year.
Aaron Jones over-performed in rushing TDs for the 2019 season based off the probability distribution we
calculated. Given Aaron Jones' quality and quantity of usage throughout the 2019 season, he would have been
expected to score around 7 touchdowns on the season. If you owned Aaron Jones, this is not surprising. But, this
may also be due to the fact that our model is fairly conservative. Again, let's not focus too much on the gap
between actual and expected. It's Jones' relative position when we rank our model that should be more cause for
concern (considering he was #1 in TDs this season amongst these same peers). Moving onwards - let's run
(basically) the same analysis for receiving TDs.
As you can see, formatting descriptions to names for receivers was a bit more tedious, but the process is
virtually identical.
Let's compare expected to actual again.
Not as bad for receiving TDs, it seems as though Aaron Jones caught as many receiving TDs as expected.
Conclusions
1. Aaron Jones had a stellar season and ranked second in RBs for PPR, but that doesn't tell the whole picture.
Henry posted almost the same amount of Fantasy Points per game with a lower standard deviation. Points are the
name of the game but don't tell the whole picture. You also have to look at how consistently a player is getting
you points. Aaron Jones finished second on the season for ALL players in terms of standard deviation. Not a good
look if you're looking for consistency.
2. We found that there was no statistically significant relationship between Jamaal Williams' usage and Aaron
Jones' production. Our p-value was close though, and there did seem to be negative some correlation, so take
that with a grain of salt.
3. Lastly, based off the probability distribution we made for both rushing and receiving TDs, it looks like
Aaron Jones really overperformed in terms of rushing output, and did about just as expected for receiving. One
caveat here is that our model was fairly conservative, but Jones still finished 10th in TDs in our model. Jones'
relative position in our model is probably more indicative of a negative regression than the magnitude of the
spread between his actual TDs and expected TDs. Hot take: don't be surprised to see a negative regression in
rushing TDs for Aaron Jones come the 2020 season.
Moreover, it seems like Jones is going to be in an even bigger timeshare next season with the addition in the
backfield of AJ Dillon. AJ Dillon is a power back who might take away a lot of those high probability touches
from Aaron, degrading the quality of Jones' usage even further.