Learn Python with NFL Data - Next Gen Stats
In this part of the intermediate series, learn how to use Python and matplotlib to visualize the pass locations of some top QBs in 2019.
In this part of the intermediate series, learn how to use Python and matplotlib to visualize the pass locations of some top QBs in 2019.
If you have any questions about the code here, feel free to reach out to me on Twitter or on Reddit.
If you like Fantasy Football and have an interest in learning how to code, check out our Ultimate Guide on Learning Python with Fantasy Football Online Course. Here is a link to purchase for 15% off. The course includes 15 chapters of material, 14 hours of video, hundreds of data sets, lifetime updates, and a Slack channel invite to join the Fantasy Football with Python community.
In this post we're going to continue the trend of doing stuff more on the NFL analytics side than fantasy football side of stuff.
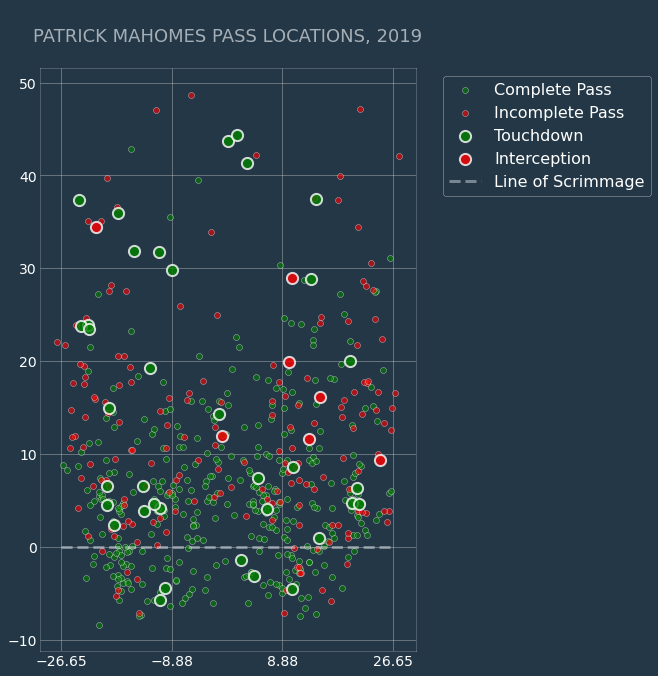
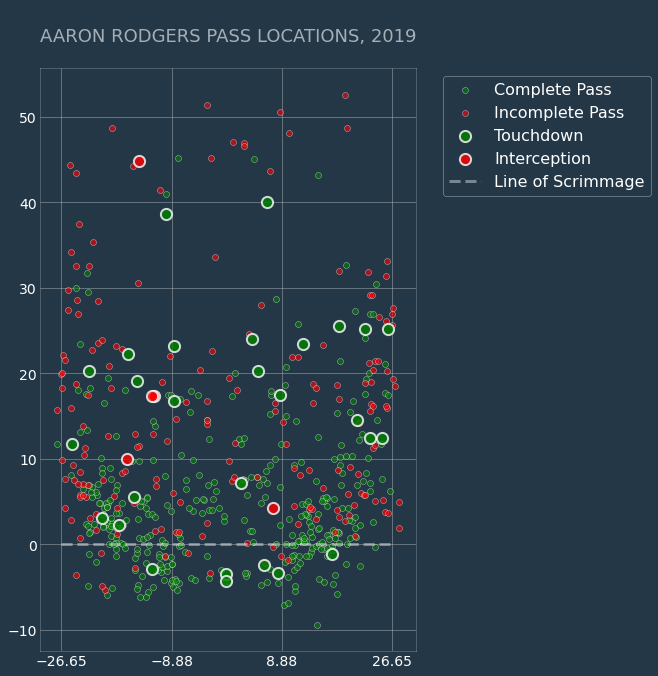
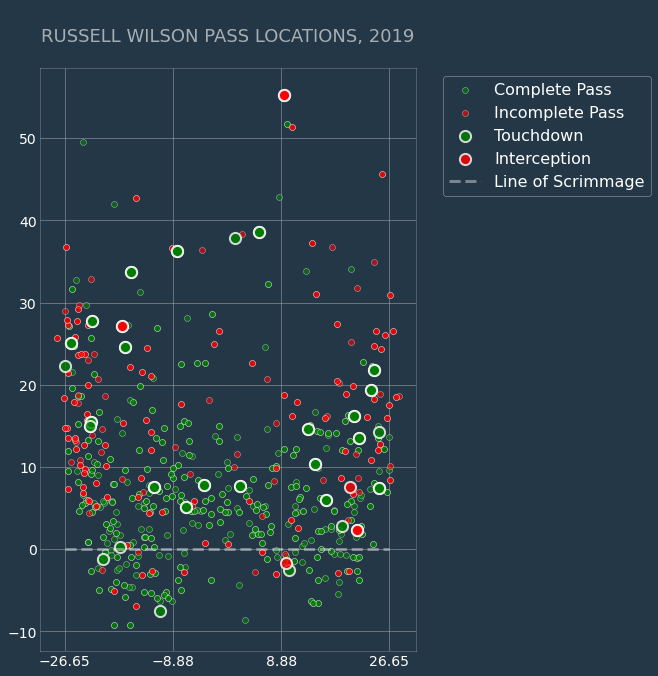
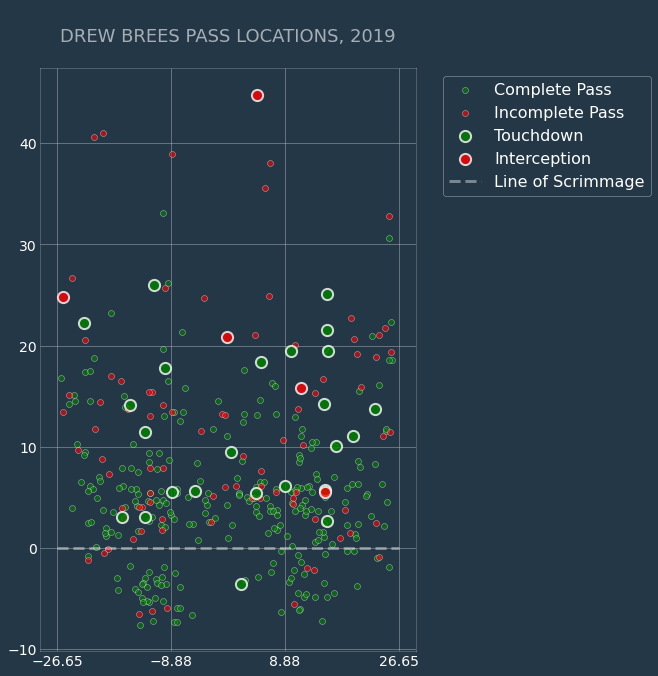
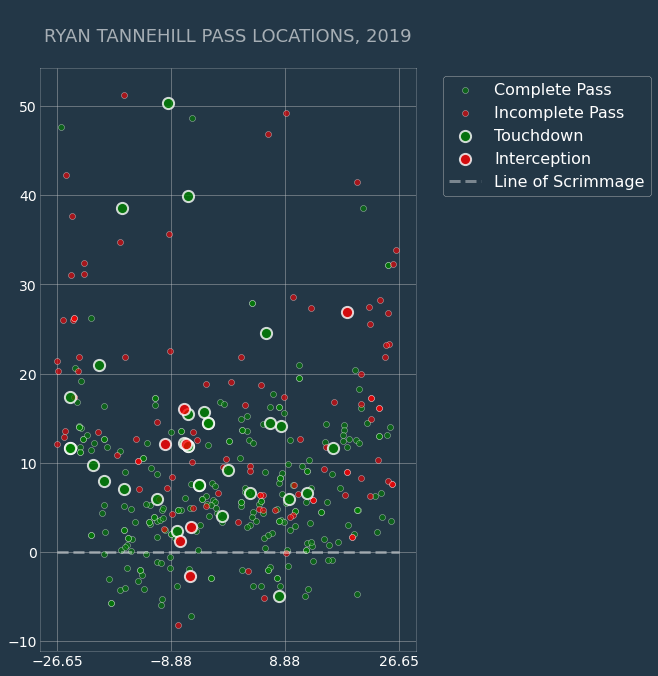
I found this github repo that has next gen stats and passing locations, so what we're going to do in this post is visualize where QBs threw their completions, incompletions, interceptions and TDs in the 2019 season. Unfortanetly, data for 2020 is not yet available :( You can scroll down and check out our final visualizations for this post.
To start, let's import our standard libraries in Google Colab or your locally hosted jupyter notebook.
Next, let's laod the data source from the github repo and check out the results.
Let's inspect our DataFrame.
Here, we can see that we have data on each QB's pass locations, via the x_coord and y_coord columns. The x_coord tells us how east-west each throw went from the QBs frame of reference, and the y_coord tells us how north-south each throw went. Do note that these aren't yardlines, it's data telling us how far east-west and north-south a throw went relative to where the QB was on the field.
| game_id | team | week.x | name | pass_type | x_coord | y_coord | game_id.y | season | game_type | week.y | gameday | weekday | gametime | away_team | home_team | away_score | home_score | home_result | stadium | location | roof | surface | |
|---|---|---|---|---|---|---|---|---|---|---|---|---|---|---|---|---|---|---|---|---|---|---|---|
| 1 | 2017091004 | ARI | 1 | Carson Palmer | COMPLETE | 13.5 | -2.8 | 2017_01_ARI_DET | 2017 | REG | 1 | 2017-09-10 | Sunday | 13:00 | ARI | DET | 23 | 35 | 12 | Ford Field | Home | dome | fieldturf |
| 2 | 2017091004 | ARI | 1 | Carson Palmer | COMPLETE | -13.7 | -4.4 | 2017_01_ARI_DET | 2017 | REG | 1 | 2017-09-10 | Sunday | 13:00 | ARI | DET | 23 | 35 | 12 | Ford Field | Home | dome | fieldturf |
| 3 | 2017091004 | ARI | 1 | Carson Palmer | COMPLETE | 2.2 | 7.1 | 2017_01_ARI_DET | 2017 | REG | 1 | 2017-09-10 | Sunday | 13:00 | ARI | DET | 23 | 35 | 12 | Ford Field | Home | dome | fieldturf |
| 4 | 2017091004 | ARI | 1 | Carson Palmer | COMPLETE | 23.9 | 10.0 | 2017_01_ARI_DET | 2017 | REG | 1 | 2017-09-10 | Sunday | 13:00 | ARI | DET | 23 | 35 | 12 | Ford Field | Home | dome | fieldturf |
| 5 | 2017091004 | ARI | 1 | Carson Palmer | COMPLETE | -23.5 | 14.6 | 2017_01_ARI_DET | 2017 | REG | 1 | 2017-09-10 | Sunday | 13:00 | ARI | DET | 23 | 35 | 12 | Ford Field | Home | dome | fieldturf |
And let's see how many seasons we have to work with using the Series method, unique.
Before we filter based off season, let's also check out the data type of this column (let's make sure it's not a string).
Awesome, so it's an integer. With that information, let's filter our DataFrame to only include 2019 data.
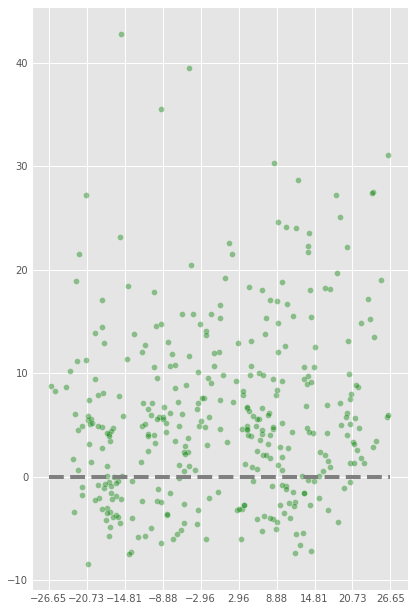
We're going to be writing a function to automate the process of visualization each player's pass_type. To start, though, let's grab Patrick Mahomes and visualize his complete passes.
| game_id | team | week.x | name | pass_type | x_coord | y_coord | game_id.y | season | game_type | week.y | gameday | weekday | gametime | away_team | home_team | away_score | home_score | home_result | stadium | location | roof | surface | |
|---|---|---|---|---|---|---|---|---|---|---|---|---|---|---|---|---|---|---|---|---|---|---|---|
| 25293 | 2019090802 | KC | 1 | Patrick Mahomes | COMPLETE | -15.1 | 5.9 | 2019_01_KC_JAX | 2019 | REG | 1 | 2019-09-08 | Sunday | 13:00 | KC | JAX | 40 | 26 | -14 | TIAA Bank Stadium | Home | outdoors | grass |
| 25294 | 2019090802 | KC | 1 | Patrick Mahomes | COMPLETE | 8.8 | 7.9 | 2019_01_KC_JAX | 2019 | REG | 1 | 2019-09-08 | Sunday | 13:00 | KC | JAX | 40 | 26 | -14 | TIAA Bank Stadium | Home | outdoors | grass |
| 25295 | 2019090802 | KC | 1 | Patrick Mahomes | COMPLETE | 21.1 | 5.7 | 2019_01_KC_JAX | 2019 | REG | 1 | 2019-09-08 | Sunday | 13:00 | KC | JAX | 40 | 26 | -14 | TIAA Bank Stadium | Home | outdoors | grass |
| 25296 | 2019090802 | KC | 1 | Patrick Mahomes | COMPLETE | -5.6 | 0.6 | 2019_01_KC_JAX | 2019 | REG | 1 | 2019-09-08 | Sunday | 13:00 | KC | JAX | 40 | 26 | -14 | TIAA Bank Stadium | Home | outdoors | grass |
| 25297 | 2019090802 | KC | 1 | Patrick Mahomes | COMPLETE | 13.8 | 22.3 | 2019_01_KC_JAX | 2019 | REG | 1 | 2019-09-08 | Sunday | 13:00 | KC | JAX | 40 | 26 | -14 | TIAA Bank Stadium | Home | outdoors | grass |
So the pass_type column here is going to be crucial. Let's inspect the unique values of this Series to see what we have to work with.
With that, let's just plot completions to start.
Pretty cool. With that, let's write a function to visualize completions along with incompletions, touchdowns, and interceptions and style each pass type accordingly.