Learn Python with Fantasy Football: Rushing TD Regression Candidates
Learn how to use Python to find rushing TD regression candidates for your 2021 season.
Learn how to use Python to find rushing TD regression candidates for your 2021 season.
Hi all, in this part of the intermediate series, I'm going to take you through part of a project we go through in the python course offered on this site - only this post is going to give a look into the current season. The course offers a more in-depth analysis of this project along with an hour long video explanation.
We are going to be doing a TD regression analysis for RBs. Essentially, for each RB this season, we'll be looking at their number of carries + how far each carry was from the endzone. Based off how far a player received a carry from the endzone, we assign a score or expected touchdown value to their carry based off historical numbers on how probable a TD is from that given yardline. Once you add each carry's expected TD value for each RB, you'll get an expected TD number for the entire season. For each RB, we'll be comparing that expected TD value to the actual TD values they posted. If a player actually scored more TDs than their expected TD value, we can say they are due for negative regression and "over performed" so far this season. And vice versa if their expected TD value was higher than their actual TD posting. This will help us mid season to assess if players should have gotten more TDs to this point and give us insight when making roster moves in fantasy football.
There is actually quite a bit of statistics that go into this. Since we have the probability of a score from a given yardline, does it make sense to simply add up all the rush attempts from a player in a single drive? One thing you may notice is that the TD probability from a rush attempted on the 1 yardline is greater than 50%. This means that if a player attempts 2 rushes from the 1 yardline their expected touchdowns is greater than 1. The problem with this is although technically that is true, a player cannot score more than 1 touchdown on a drive. To get around this we implement a cap at 1 touchdown per drive.
No analysis is perfect - we are treating every RB as if they have the same talent level. Obviously some RBs have that special ability to break off a 60 yard TD at any moment, while other RBs simply do not. Those RBs that have that special ability to break off a huge play at any moment obviously have a higher probability of scoring a TD per handoff than an average RB. Thus, those RBs will be underweighted using this sort of analysis. Conversely, RBs that don't have that special ability are overweighted by this sort of analysis. This analysis is still very valuable since it is using an on average approach to allow us to assess the opportunity based value of a player compared to their actual performance.
Feel free to scroll to the bottom to get a list of RB expected and actual touchdowns scored.
With that out of the way, let's start work on the project. You'll need to run this code in a notebook environment, for those unfamiliar with my content, and the easiest solution would be to set up a Google Colab runtime.
To start, we're going to be installing the nflfastpy library which is maintained by Fantasy Football Data Pros. It pulls from the nflfastR data package and exposes 20 years of play by play data.
Importing our libraries as always, and setting the style for our visualizations.
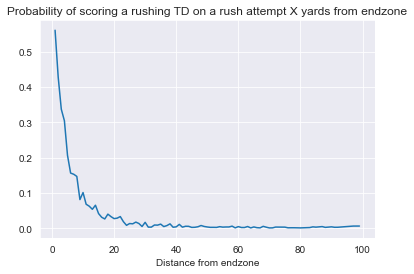
In this first block of code, we are going to be pulling data from the past 5 years of the NFL, excluding the most recent season and concatenating the data together into one big DataFrame. We will be using this data to find the probability of scoring a touchdown X yards from the endzone, for each value of X 0 - 100, and putting this all in to a DataFrame we'll call rushing_df_probs.
Now we're going to take our big DataFrame and transform it the way I described. Like I said earlier, this post will not be as in depth as my course, so if the code here confuses a bit, it's covered a bit more in depth in the course. I've added some comments to each line to explain what we're doing.
| yardline_100 | probability_of_touchdown | |
|---|---|---|
| 0 | 1.0 | 0.560390 |
| 3 | 2.0 | 0.428058 |
| 5 | 3.0 | 0.336910 |
| 7 | 4.0 | 0.304251 |
| 9 | 5.0 | 0.206349 |
Now we can plot our DataFrame you see above so we can visualize the probability of scoring a rushing touchdown X yards from the endzone. As anyone could have expected, as you get farther from the endzone, the less probable it is a TD will occur. We're more concerned with the values from the DataFrame and using it it calculate expected TDs than any sort of revelation from visualizing this data.
Now we'll load in 2021 data. We're going to use the rushing_df_probs DataFrame to calculate expected TD values for each RB in the 2021 season, then compare that calculated value to actual TDs scored.
Below, we're going to filter, clean, and merge our data a bit. I've added comments above each operation.
| rusher_id | drive_id | rusher_player_name | rush_attempt | rush_touchdown | yardline_100 | probability_of_touchdown | |
|---|---|---|---|---|---|---|---|
| 0 | 00-0032764 | 2021_01_ARI_TEN_1 | D.Henry | 1.0 | 0.0 | 75.0 | 0.003111 |
| 1 | 00-0035228 | 2021_01_ARI_TEN_2 | K.Murray | 1.0 | 0.0 | 23.0 | 0.018553 |
| 2 | 00-0034681 | 2021_01_ARI_TEN_2 | C.Edmonds | 1.0 | 0.0 | 9.0 | 0.081081 |
| 3 | 00-0032764 | 2021_01_ARI_TEN_3 | D.Henry | 1.0 | 0.0 | 80.0 | 0.000969 |
| 4 | 00-0032764 | 2021_01_ARI_TEN_5 | D.Henry | 1.0 | 0.0 | 75.0 | 0.003111 |
Now, we have a DataFrame that contains each rush attempt for the season by an RB, with each play assigned an expected touchdown value. All that's left to do now is to group by rusher id and add up the actual touchcowns and the expected values, right? Recall in the beginning of this post we discussed the problem I originally ran into when running this sort of analysis. Some RBs would receive a greater than 1 value for expected TDs on a given drive, which doesn't make sense.
I was considering different ways to approach this problem. I considered using conditional probability, but since we already know the outcome of the events it isn't the most appropriate use. In my opinion the best thing we can do is cap the per drive TD maximum at 1. This made the most sense to me since if a RB gets 3 rushes from the 1 yardline I would say he should have scored based on his opportunity.
So, we need to limit expected TDs to 1 per drive, or at the very least, very close to 1. That was the reason for assigning a drive id column above. First, we will add expected values for each RB, drive without this cap.
We can see here we have 18 instances where an RB was assigned a expected TD value of greater than 1 on a single drive. Let's cap all drives to 0.999.
Now that we've gotten that out of the way, let's groupby again and this time only group by rusher id. We'll assign a column called positive_regression_candidate which will flash True when expected touchdowns > actual touchdowns, indicating a player may be due for positive regression. The delta column we assign here will be the difference expected and actual touchdowns.
| rusher_id | rusher_player_name | actual_touchdowns | expected_touchdowns | positive_regression_candidate | delta | |
|---|---|---|---|---|---|---|
| 73 | 00-0032764 | D.Henry | 10.0 | 7.339330 | False | 2.660670 |
| 209 | 00-0036223 | J.Taylor | 6.0 | 7.021710 | True | 1.021710 |
| 186 | 00-0035657 | D.Harris | 6.0 | 5.897961 | False | 0.102039 |
| 189 | 00-0035664 | D.Henderson | 5.0 | 5.003799 | True | 0.003799 |
| 108 | 00-0033856 | L.Fournette | 4.0 | 4.867322 | True | 0.867322 |
All that's left now is to visualize the results, but I encourage you to mess around with this data because it's interesting and useful on it's own. I've added some comments to the code below to guide you through it once again.
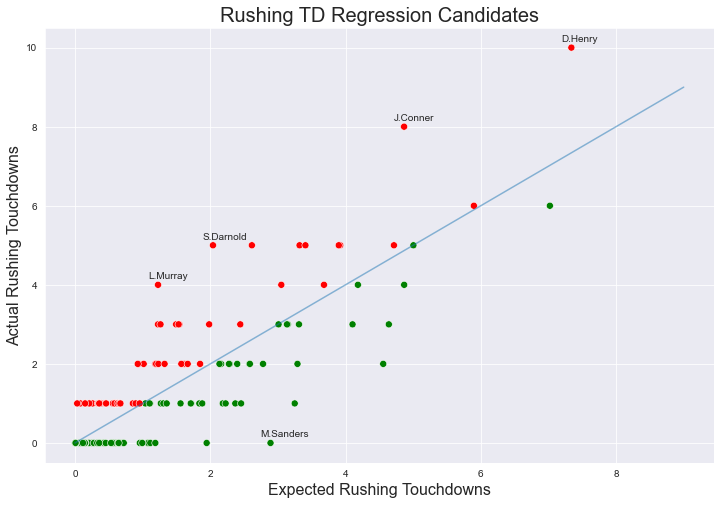
The Henry injury is devastating, but lets use him as an example to interpret this plot. Unsurprisingly Derrick Henry finds himself at the top of the list in terms of expected touchdowns and actual touchdowns. The plot suggests that Henry is over performing, but like I mentioned in the beginning of the post we are not taking into account each individual rusher's ability, and this is Derrick Henry we are talking about. If the average rusher got the opportunities Henry has gotten this season I might think that the TD production will not be sustainable, but there is 0 reason to suggest Henry was over performing and would regress to the mean if he stayed healthy.
Someone like Sam Darnold on the other hand is a huge regression candidate since he ran in 5 TDs in the first 4 weeks of the season. He has yet to score a rushing touchdown since then (this analysis is taking place after week 7) which means we are already seeing a sort of regression to the mean. Its safe to say we do not expect Darnold to be the leading TD rusher (or anywhere near it like he was after week 4).
I anticipate Miles Sanders to get it going, at least more than he has so far this season since he is still without a TD. Don't expect him to be a top 10 RB (or even top 15) since Hurts will continue to sap his value, but with Sanders under performing his expected TD value by 3, I'd wager he will find the endzone sooner rather than later.
That's all for this post. Thank you for reading, you guys are awesome!
Here are all the RBs from this season that have at least 1 expected touchdown.
| rusher_id | rusher_player_name | actual_touchdowns | expected_touchdowns | positive_regression_candidate | delta | |
|---|---|---|---|---|---|---|
| 73 | 00-0032764 | D.Henry | 10.0 | 7.339330 | False | 2.660670 |
| 209 | 00-0036223 | J.Taylor | 6.0 | 7.021710 | True | 1.021710 |
| 186 | 00-0035657 | D.Harris | 6.0 | 5.897961 | False | 0.102039 |
| 189 | 00-0035664 | D.Henderson | 5.0 | 5.003799 | True | 0.003799 |
| 108 | 00-0033856 | L.Fournette | 4.0 | 4.867322 | True | 0.867322 |
| 102 | 00-0033553 | J.Conner | 8.0 | 4.865928 | False | 3.134072 |
| 83 | 00-0033045 | E.Elliott | 5.0 | 4.715967 | False | 0.284033 |
| 92 | 00-0033293 | A.Jones | 3.0 | 4.640432 | True | 1.640432 |
| 117 | 00-0033906 | A.Kamara | 2.0 | 4.557704 | True | 2.557704 |
| 235 | 00-0036389 | J.Hurts | 4.0 | 4.183223 | True | 0.183223 |
| 259 | 00-0036893 | N.Harris | 3.0 | 4.103959 | True | 1.103959 |
| 105 | 00-0033699 | A.Ekeler | 5.0 | 3.922145 | False | 1.077855 |
| 116 | 00-0033897 | J.Mixon | 5.0 | 3.900342 | False | 1.099658 |
| 148 | 00-0034791 | N.Chubb | 4.0 | 3.681646 | False | 0.318354 |
| 198 | 00-0035831 | J.Robinson | 5.0 | 3.407411 | False | 1.592589 |
| 120 | 00-0033923 | K.Hunt | 5.0 | 3.320475 | False | 1.679525 |
| 265 | 00-0036924 | Mi.Carter | 3.0 | 3.311899 | True | 0.311899 |
| 149 | 00-0034796 | L.Jackson | 2.0 | 3.289903 | True | 1.289903 |
| 11 | 00-0027966 | M.Ingram | 1.0 | 3.248947 | True | 2.248947 |
| 211 | 00-0036251 | Z.Moss | 3.0 | 3.147690 | True | 0.147690 |
| 218 | 00-0036275 | D.Swift | 3.0 | 3.134956 | True | 0.134956 |
| 130 | 00-0034301 | Da.Williams | 4.0 | 3.050942 | False | 0.949058 |
| 223 | 00-0036328 | A.Gibson | 3.0 | 3.009944 | True | 0.009944 |
| 173 | 00-0035243 | M.Sanders | 0.0 | 2.891143 | True | 2.891143 |
| 79 | 00-0032972 | D.Booker | 2.0 | 2.780498 | True | 0.780498 |
| 192 | 00-0035700 | J.Jacobs | 5.0 | 2.615657 | False | 2.384343 |
| 114 | 00-0033893 | D.Cook | 2.0 | 2.585961 | True | 0.585961 |
| 66 | 00-0032426 | A.Collins | 2.0 | 2.579420 | True | 0.579420 |
| 273 | 00-0036997 | J.Williams | 1.0 | 2.455934 | True | 1.455934 |
| 59 | 00-0032144 | M.Gordon | 3.0 | 2.444273 | False | 0.555727 |
| 158 | 00-0034857 | J.Allen | 2.0 | 2.398869 | True | 0.398869 |
| 52 | 00-0031806 | M.Brown | 1.0 | 2.370514 | True | 1.370514 |
| 121 | 00-0033948 | J.Williams | 2.0 | 2.288534 | True | 0.288534 |
| 172 | 00-0035228 | K.Murray | 2.0 | 2.277217 | True | 0.277217 |
| 183 | 00-0035537 | T.Johnson | 1.0 | 2.227564 | True | 1.227564 |
| 89 | 00-0033280 | C.McCaffrey | 1.0 | 2.185380 | True | 1.185380 |
| 193 | 00-0035710 | D.Jones | 2.0 | 2.160797 | True | 0.160797 |
| 241 | 00-0036555 | C.Hubbard | 2.0 | 2.136616 | True | 0.136616 |
| 159 | 00-0034869 | S.Darnold | 5.0 | 2.040697 | False | 2.959303 |
| 136 | 00-0034414 | B.Scott | 3.0 | 1.984017 | False | 1.015983 |
| 84 | 00-0033077 | D.Prescott | 0.0 | 1.946874 | True | 1.946874 |
| 262 | 00-0036906 | K.Herbert | 1.0 | 1.881730 | True | 0.881730 |
| 155 | 00-0034844 | S.Barkley | 2.0 | 1.849759 | False | 0.150241 |
| 56 | 00-0032063 | M.Davis | 1.0 | 1.842768 | True | 0.842768 |
| 145 | 00-0034681 | C.Edmonds | 1.0 | 1.839042 | True | 0.839042 |
| 77 | 00-0032950 | C.Wentz | 1.0 | 1.718546 | True | 0.718546 |
| 152 | 00-0034816 | R.Jones | 1.0 | 1.711764 | True | 0.711764 |
| 205 | 00-0036096 | J.Taylor | 2.0 | 1.666519 | False | 0.333481 |
| 31 | 00-0030578 | C.Patterson | 2.0 | 1.617028 | False | 0.382972 |
| 32 | 00-0030874 | D.Williams | 2.0 | 1.572870 | False | 0.427130 |
| 70 | 00-0032602 | J.McKissic | 1.0 | 1.560870 | True | 0.560870 |
| 191 | 00-0035685 | D.Montgomery | 3.0 | 1.543478 | False | 1.456522 |
| 242 | 00-0036567 | E.Mitchell | 3.0 | 1.532005 | False | 1.467995 |
| 104 | 00-0033594 | C.Carson | 3.0 | 1.495154 | False | 1.504846 |
| 276 | 00-0037012 | T.Lance | 1.0 | 1.355950 | True | 0.355950 |
| 268 | 00-0036971 | T.Lawrence | 2.0 | 1.324875 | False | 0.675125 |
| 156 | 00-0034845 | S.Michel | 1.0 | 1.307333 | True | 0.307333 |
| 72 | 00-0032741 | P.Barber | 1.0 | 1.269330 | True | 0.269330 |
| 96 | 00-0033357 | T.Hill | 3.0 | 1.264787 | False | 1.735213 |
| 264 | 00-0036919 | K.Gainwell | 2.0 | 1.233825 | False | 0.766175 |
| 28 | 00-0030513 | L.Murray | 4.0 | 1.227994 | False | 2.772006 |
| 42 | 00-0031345 | J.Garoppolo | 3.0 | 1.227769 | False | 1.772231 |
| 74 | 00-0032780 | J.Howard | 2.0 | 1.200711 | False | 0.799289 |
| 215 | 00-0036265 | A.Dillon | 0.0 | 1.188196 | True | 1.188196 |
| 41 | 00-0031285 | D.Freeman | 2.0 | 1.188181 | False | 0.811819 |
| 146 | 00-0034750 | R.Penny | 0.0 | 1.117933 | True | 1.117933 |
| 177 | 00-0035311 | M.Gaskin | 0.0 | 1.114066 | True | 1.114066 |
| 0 | 00-0019596 | T.Brady | 1.0 | 1.109926 | True | 0.109926 |
| 175 | 00-0035261 | T.Pollard | 1.0 | 1.103899 | True | 0.103899 |
| 161 | 00-0034972 | A.Mattison | 0.0 | 1.082761 | True | 1.082761 |
| 34 | 00-0031045 | C.Hyde | 0.0 | 1.070865 | True | 1.070865 |
| 174 | 00-0035250 | D.Singletary | 1.0 | 1.040830 | True | 0.040830 |
| 185 | 00-0035628 | D.Johnson | 2.0 | 1.016086 | False | 0.983914 |