If you have any questions about the code here, feel free to reach out to me on Twitter or on Reddit.
Shameless Plug Section
If you like Fantasy Football and have an interest in learning how to code,
check out our Ultimate Guide on Learning Python with Fantasy Football Online Course.
Here is a link to purchase for 15% off.
The course includes 16 chapters of material, 14 hours of video, hundreds of data sets, lifetime updates,
and a Slack channel invite to join the Fantasy Football with Python community.
When evaluating end-of-season performance look at points scored, not rank
In this part of the intermediate series, we're gonna recap the 2020 season by learning about a bit more about stacked bar plots, visualizing where each of the top 50 RBs on the season got the majority of their fantasy points, and talking about how to evaluate end-of-year performance for players.
This post is partly inspired by a reddit post made to the fantasyfootball sub linked here. The TLDR of the post is basically that to properly evaluate player performance within a position, look at total points scored, not rankings. Here's an example that proves why this is probably wise.
Alvin Kamara, Dalvin Cook, and Derrick Henry were the RB 1, 2, and 3 this season (in PPR). They scored 378, 338, 333, respectively. The RB4 was David Montgomery, and he scored 265 points. That's 68 points behind Henry (4.25 points per game), 73 behind Cook (4.56/game), and 113 points behind Kamara (7.06/game!). Obviously it isn't fair to compare Kamara to Montgomery like you could literally any other set of players whose rank differential was 3 (eg. Kareem Hunt to Antonio Gibson. 3 rank differential, 1.06 points/game differential).
As we'll see below, using a horizontal bar plot is a good way to visualize how much marginally better a player was over the next-best ranked player. We'll be doing this analysis for RBs, and we'll see that the top three running backs (Alvin Kamara, Dalvin Cook, and Derrick Henry) are in their own tier, while everyone else lags behind. The rest of the RBs tend to cluster together in terms of their performances. This means that the reddit post was true, but most true when comparing top-tier players to mid-tier players.
In short, it was super valuable to own any of Kamara, Cook, Henry this season, while you could have owned any of the RBs in the 5 - 15 range and it wouldn't have made a huge difference (exception below).
Of course, we're always thinking about player value when it comes to fantasy football. You paid a price for Kamara, Cook, and Henry - specifically, a first round pick in redraft. /r/fantasyfootball poster boy James Robinson was the cost of a week one waiver order in most leagues or 10% FAAB. So even though Robinson finished RB7 on the season, and he didn't provide a huge marginal benefit over other RBs like Kamara/Cook/Henry did, you still were able to pick up an RB with second round value for basically free. That's extremely valuable in it's own right, for obvious reasons.
The post caught some flack for looking at total points scored and not points per game (not accounting for injuries, basically).
Sure, there were players who missed some time and thus finished the season in the rankings and points scored category much lower than they would have
if they played a full season. When McCaffrey played this season, he put up definitive RB1 numbers, but the fact remains that he hardly played.
I would have rather have had David Montgomery this season than McCaffrey, even though CMC would have certainly have been in the same tier as Cook/Kamara/Henry
this season.
Finally, be aware that these are end-of-season rankings, including week 17. I'll try to put together a data set with weekly data for 2020 so you can run this analysis up to week 16, if you'd like.
There's some obvious problems with doing this sort of analysis after week 17 and not week 16, namely that certain players don't play week 17 because teams rest their starters and a lot of fantasy seasons end week 16.
With all the disclaimers out of the way, let's write some code.
Into writing the code
We're going to be using a CSV file I've compiled with 2020 fantasy football stats. Data like this is available going back to 1970 through a github repository I maintain here.
We'll need two libraries for this project, pandas and matplotlib. We import them in the first cell of our notebook environment.
Next, we load our data in to pandas using the read_csv function.
|
Player |
Tm |
Pos |
Age |
G |
GS |
Tgt |
Rec |
PassingYds |
PassingTD |
PassingAtt |
RushingYds |
RushingTD |
RushingAtt |
ReceivingYds |
ReceivingTD |
FantasyPoints |
Int |
Fumbles |
FumblesLost |
| 0 |
Derrick Henry |
TEN |
RB |
26.0 |
16 |
16 |
31 |
19 |
0 |
0 |
0 |
2027 |
17 |
378 |
114 |
0 |
314.0 |
0 |
3 |
2 |
| 1 |
Alvin Kamara |
NOR |
RB |
25.0 |
15 |
10 |
107 |
83 |
0 |
0 |
0 |
932 |
16 |
187 |
756 |
5 |
295.0 |
0 |
1 |
0 |
| 2 |
Dalvin Cook |
MIN |
RB |
25.0 |
14 |
14 |
54 |
44 |
0 |
0 |
0 |
1557 |
16 |
312 |
361 |
1 |
294.0 |
0 |
5 |
3 |
| 3 |
Davante Adams |
GNB |
WR |
28.0 |
14 |
14 |
149 |
115 |
0 |
0 |
0 |
0 |
0 |
0 |
1374 |
18 |
243.0 |
0 |
1 |
1 |
| 4 |
Travis Kelce |
KAN |
TE |
31.0 |
15 |
15 |
145 |
105 |
4 |
0 |
2 |
0 |
0 |
0 |
1416 |
11 |
208.0 |
0 |
1 |
1 |
Here, we're doing some basic data manipulation. We filter based off position to grab only RBs and grab the necessary columns.
I mentioned in the beginning of the post that we would not only be addressing the point/rank problem, but also visualizing where each RB got their points from. When I say where, I mean from which stat category (rushing yards, receiving yards, receptions, etc.) Luckily, we can visualize both these concepts at once with a stacked bar plot. We'll take each fantasy-relevant column and multiply it by their fantasy weight. The sum (or stack) of each of these fantasy relevant columns multiplied by their their respective fantasy weights is a player's fantasy point scored (receptions + total yards * 0.1 + total TDs * 6 - fumbles * -2). The stacked bar plot for reach player will show us the proportion of fantasy points a player accrued for each fantasy relevant stat category.
|
Player |
RushingYds |
RushingTD |
Rec |
ReceivingYds |
ReceivingTD |
FantasyPoints |
PPRPoints |
| 0 |
Alvin Kamara |
93.2 |
96 |
83 |
75.6 |
30 |
295.0 |
378.0 |
| 1 |
Dalvin Cook |
155.7 |
96 |
44 |
36.1 |
6 |
294.0 |
338.0 |
| 2 |
Derrick Henry |
202.7 |
102 |
19 |
11.4 |
0 |
314.0 |
333.0 |
| 3 |
David Montgomery |
107.0 |
48 |
54 |
43.8 |
12 |
211.0 |
265.0 |
| 4 |
Aaron Jones |
110.4 |
54 |
47 |
35.5 |
12 |
212.0 |
259.0 |
| 5 |
Jonathan Taylor |
116.9 |
66 |
36 |
29.9 |
6 |
217.0 |
253.0 |
| 6 |
James Robinson |
107.0 |
42 |
49 |
34.4 |
18 |
201.0 |
250.0 |
| 7 |
Josh Jacobs |
106.5 |
72 |
33 |
23.8 |
0 |
198.0 |
231.0 |
| 8 |
Ezekiel Elliott |
97.9 |
36 |
52 |
33.8 |
12 |
172.0 |
224.0 |
| 9 |
Kareem Hunt |
84.1 |
36 |
38 |
30.4 |
30 |
181.0 |
219.0 |
| 10 |
Nick Chubb |
106.7 |
72 |
16 |
15.0 |
0 |
192.0 |
208.0 |
| 11 |
Mike Davis |
64.2 |
36 |
59 |
37.3 |
12 |
148.0 |
207.0 |
| 12 |
Antonio Gibson |
79.5 |
66 |
36 |
24.7 |
0 |
166.0 |
202.0 |
| 13 |
Melvin Gordon |
98.6 |
54 |
32 |
15.8 |
6 |
166.0 |
198.0 |
| 14 |
Nyheim Hines |
38.0 |
18 |
63 |
48.2 |
24 |
130.0 |
193.0 |
Now, all that's left to do is to plot the data. Our rb_df we're left with has the top 50 RBs in terms of PPR fantasy points scored (you're welcome to do this sort of analysis for half PPR or standard). Moreover, we're left with data on how many fantasy points each player recorded in each relevant fantasy stat category. Adding all of these columns up for each player will give us a fantasy points scored and the (sort-of, not including fumbles lost) length of our stacked bar plot for each player.
And that's our visualization!
As we talked about earlier in the post, Kamara, Cook, and Henry all appear to be in their own tier. There's a huge gap between these three players and the next best RB, Montgomery.
There's a ton of interesting insights you can glean from this, and it kind of tells a story of each player's stat performance for the season. For example, it's easy to see that Henry and Chubb had a relatively low amount of fantasy points accrued via receptions, compared to Cook or Kamara.
Thanks for reading!
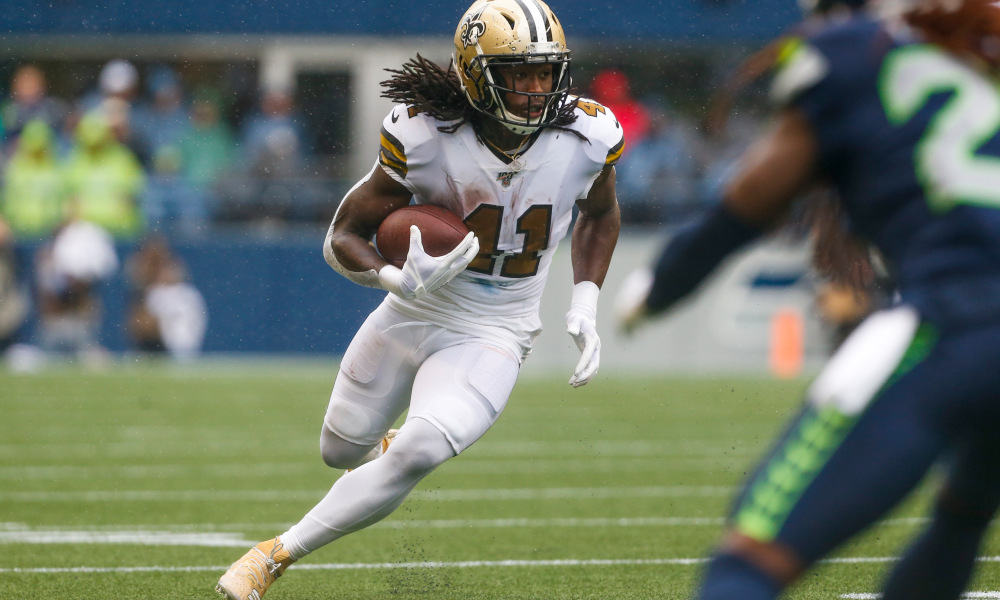 Photo by Joe Nicholson, USA TODAY Sports