Learn Python with NFL Data: Air Yards Analysis
Learn how to use Python to evaluate receiver air yards.
Learn how to use Python to evaluate receiver air yards.
In this post, we are going to be plotting air yards for the top 10 PPR receivers so far in the 2021 season. This will be an exercise in flexing our data visualization skills with matplotlib.
Two new things we are doing in this post: (1) we're using nflfastpy to find team colors and (2) we're also using nflfastpy to find player headshots and going to be appending them to the visualization. Just some added fluff to make our visualization look a bit nicer. Figuring out how to incorporate these two things is going to be 80% of the new stuff in this post, but it will help us strengthen our data visualization skills.
First things first, open up a new Google Colab or jupyter notebook and import the libraries you'll be needing in the first cell.
Below, we're mainly doing three things. I've commented the details in the code block below, but for a high level overview:
Firstly, we're importing 2021 play by play data using the NflFastPy package. We've been using this package alot and will use it again to get every individual play from the 2021 season so far.
Secondly, we're going to be running a groupby and sum to find those player's with the most receiving-relevant PPR fantasy points, sorting in descending order, and then grabbing the top 10. This might change by the time you run this code. This code currently works for Week 3. It should work for Week 4 and on, but you'll have to adjust things for example when we locate the player headshots.
Lastly, we're grabbing team data and roster data to merge it with our final DataFrame. This team team data contains the team color data in the form of hexidecimal code. We're going to be using team color data to color our visualizations based off which team a player is on. The roster data contains the headshots for all nfl players. These will be used as a nice finishing touch on our visualization.
| receiver_player_id | receiver_player_name | air_yards | team_color | team_logo_wikipedia | |
|---|---|---|---|---|---|
| 178 | 00-0033908 | C.Kupp | 1.0 | #003594 | https://upload.wikimedia.org/wikipedia/en/thum... |
| 180 | 00-0033908 | C.Kupp | 4.0 | #003594 | https://upload.wikimedia.org/wikipedia/en/thum... |
| 189 | 00-0033908 | C.Kupp | 4.0 | #003594 | https://upload.wikimedia.org/wikipedia/en/thum... |
| 201 | 00-0033908 | C.Kupp | -1.0 | #003594 | https://upload.wikimedia.org/wikipedia/en/thum... |
| 203 | 00-0033908 | C.Kupp | 45.0 | #003594 | https://upload.wikimedia.org/wikipedia/en/thum... |
Great! So what are we left with? We're left with rows containing each passing play each player in the top 10 PPR receiving group was involved with. The data contains the air yards for each player, the player's id, name, their team's color, and a link to their team's logo (in case you want to add that to the final visualization as well; I left it out).
Let's work on getting those player headshots appended to this DataFrame as well. Player headshots also come from NflFastPy, so let's grab those and merge them into our DataFrame.
These are the 10 players included in our passing_df.
| receiver_player_name | position | full_name | headshot_url | |
|---|---|---|---|---|
| 0 | S.Diggs | WR | Stefon Diggs | https://static.www.nfl.com/image/private/f_aut... |
| 1 | J.Chase | WR | Ja'Marr Chase | https://static.www.nfl.com/image/private/f_aut... |
| 2 | D.Adams | WR | Davante Adams | https://static.www.nfl.com/image/private/f_aut... |
| 3 | T.Kelce | TE | Travis Kelce | https://static.www.nfl.com/image/private/f_aut... |
| 4 | T.Hill | WR | Tyreek Hill | https://static.www.nfl.com/image/private/f_aut... |
| 5 | C.Kupp | WR | Cooper Kupp | https://static.www.nfl.com/image/private/f_aut... |
| 6 | K.Allen | WR | Keenan Allen | https://static.www.nfl.com/image/private/f_aut... |
| 7 | A.Thielen | WR | Adam Thielen | https://static.www.nfl.com/image/private/f_aut... |
| 8 | J.Jefferson | WR | Justin Jefferson | https://static.www.nfl.com/image/private/f_aut... |
| 9 | D.Samuel | WR | Deebo Samuel | https://static.www.nfl.com/image/private/f_aut... |
Now we can merge this roster_df that has the headshot data with our passing_df with a simple one liner.
| receiver_player_id | receiver_player_name | air_yards | team_color | team_logo_wikipedia | headshot_url | |
|---|---|---|---|---|---|---|
| 0 | 00-0033908 | C.Kupp | 1.0 | #003594 | https://upload.wikimedia.org/wikipedia/en/thum... | https://static.www.nfl.com/image/private/f_aut... |
| 1 | 00-0033908 | C.Kupp | 4.0 | #003594 | https://upload.wikimedia.org/wikipedia/en/thum... | https://static.www.nfl.com/image/private/f_aut... |
| 2 | 00-0033908 | C.Kupp | 4.0 | #003594 | https://upload.wikimedia.org/wikipedia/en/thum... | https://static.www.nfl.com/image/private/f_aut... |
| 3 | 00-0033908 | C.Kupp | -1.0 | #003594 | https://upload.wikimedia.org/wikipedia/en/thum... | https://static.www.nfl.com/image/private/f_aut... |
| 4 | 00-0033908 | C.Kupp | 45.0 | #003594 | https://upload.wikimedia.org/wikipedia/en/thum... | https://static.www.nfl.com/image/private/f_aut... |
All that's left to do is visualize the results. The hard part here will be getting the player headshots on there. We're going to be plotting each player's air yards as a kernel-density estimation.
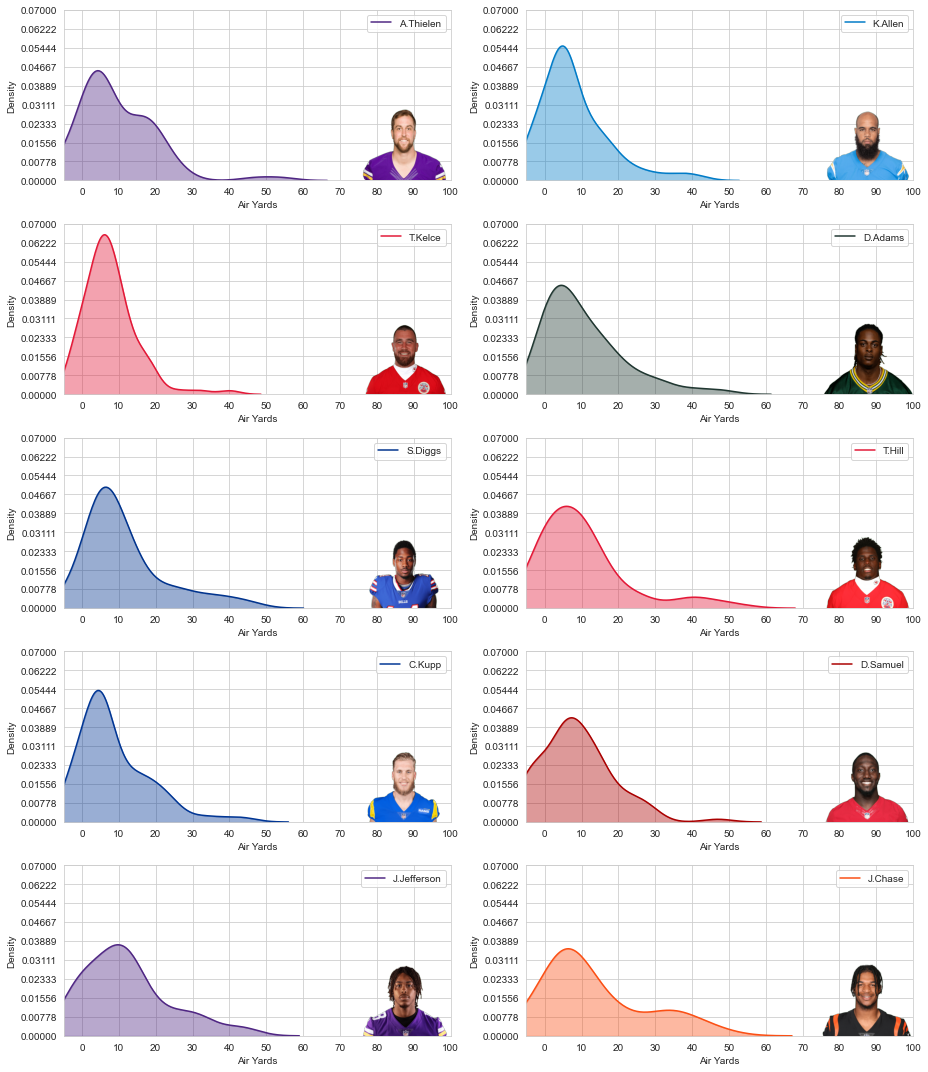
And that's it! It is interesting to see the deep play guys (Chase, Hill) have the second peak around 30 - 40 yards while someone like Kelce gets exclusively passes in the 10 yard range.
Another way to use this usefully for fantasy football analysis, is to find the top 10 player's in terms of air yards and plot their distributions instead. This will give an idea of players who get a lot of deep shots and maybe some of them will be undervalued.
Thanks for reading. Good luck in fantasy next week!