Learn Python with NFL Next Gen Data: Ezekiel Elliot
Learn how to use Python to analyze Next Gen Rushing Stats.
Learn how to use Python to analyze Next Gen Rushing Stats.
In this post we're going to take a look at NFL Next Gen Stats. I stumbled upon it recently and thought you guys would find it interesting. NFL Next Gen Stats does not have current season data available so we'll be going back and looking at some previous seasons. Hopefully this notebook will help spark some ideas for this data because it is truly endless.
Now diving into the NFL Next Gen Data. This data is one of the most comprehensive football datasets. It includes data on every snap complete with tracking data on all 22 players on the field. This means we can do things like look at the field as a whole and see positioning such as formations and personnels. An interesting model that can stem from this is looking at which formations and play types are the most effective for a team, and if there are specific set up plays that are most important to a team. NFL Next Gen Stats has access to movement data as well. Meaning that throughout the play there are multiple data points explaining where every player on the field is moving and how fast. The dataset we are looking at today is a singular data point during the play (usually a second or so after the snap). In future posts we can look at how players move throughout the play which expands our possible analyses even further.
Today we're going to just reach the tip of the iceberg which will set us up for future analysis. A good place to start is visualizing this data. Since this dataset is rather large, let's narrow down what we are looking at to Ezekiel Elliott rushes in 2018. We will take a look at plotting some of his rushes on the field level as well as looking at how well Zeke fairs against various number of defenders in the box against him.
To start, let's import our standard libraries in Google Colab or your locally hosted jupyter notebook.
Next, let's load the data source from a csv and check out the results. I already created the csv prior to this blog post since the NFL Next Gen Stats data is very large and we are only focusing on Zeke today so I went ahead and created a csv only with plays Zeke was involved in.
The first thing we need to do is create our football field. If we plan on plotting all our players on the field, we need a field right? I found most of this code on kaggle since I didn't want to create my own field from scratch so if you want a better explanation on the details you can head over there. Once we create the field we can do some insightful visualizations such as where a player gets his touches, where he is most effective, etc.
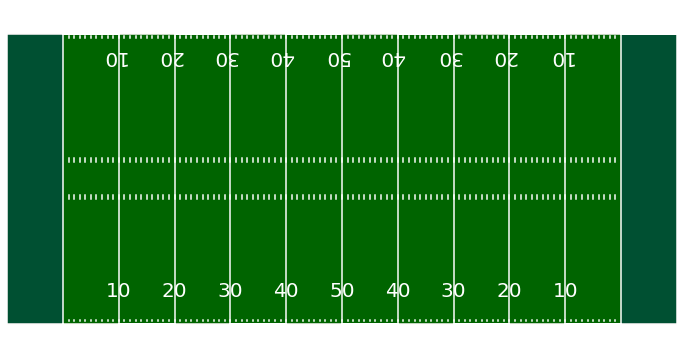
Looks pretty good right? I was happy with how it looks, and more importantly the dimensions will line up with the data from NFL Next Gen Stats which will save us many headaches. The next thing we need to do is look at the direction variable in our dataframe. We have a few columns telling us basic details about the play such as which direction the offense is driving, which team is home / away, etc. We also have details on the position, velocity, acceleration, and direction of our player at hand. I thought it would be fun to plot everyone on the field for a play and then show which direction Zeke is headed. This can be useful for analysis since we can see if hes about to hit the correct hole. The direction variable needs to be modified since it depends on which direction the offense is driving. It turns out after a bunch of geometry we just need to subtract 90 degrees from our direction angle to get the correct angle for our plot.
In the future this analysis can be improved by looking at the entire play movement rather than one point in time, but like I said earlier this is just a start. Having the field set up for us is a really good starting point that we can visualize most of our analysis on. Okay lets get to it.
Now that we fixed up the direction variable we can finally plot a play! There are 305 plays to choose from, go ahead and try out different plays and see what your find! I'll list a few for you to try.
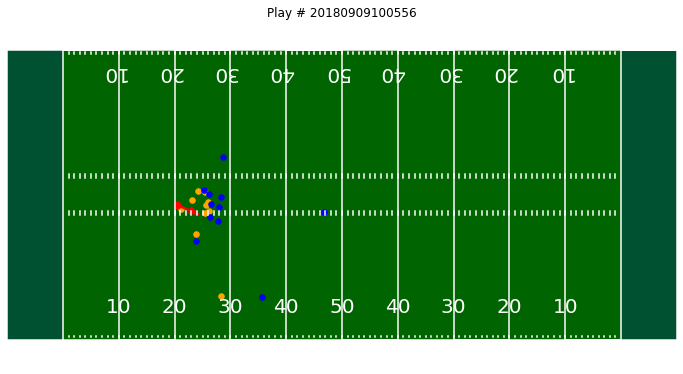
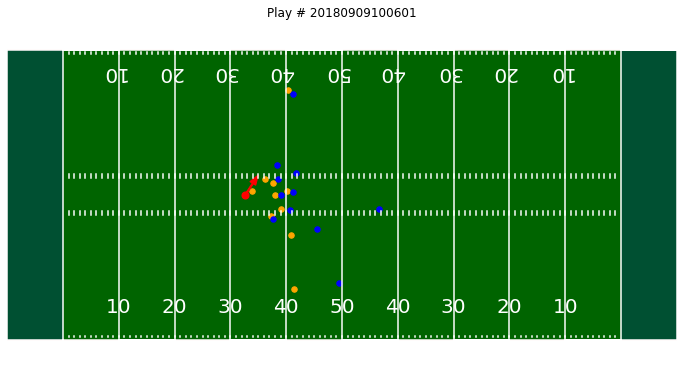
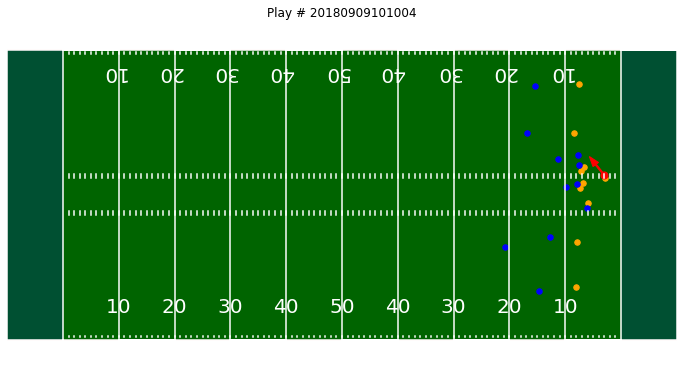
For these plots I made the home team blue, the road team orange, and Zeke (along with his direction arrow) red. I was pretty happy with these results. You can clearly see the direction of the play and who Zeke is supposed to run behind. And to reiterate again, this is just the beginning of the fun things we can do with this data. Next we can look at how well Zeke runs against different numbers of opposing linemen in the box. I'll run through this quickly and we can expand on more Next Gen Stats in future posts.
First lets look at the number of defenders in the box Zeke most often faces off against.
It looks like 6, 7, or 8 defenders are the most common. So lets zero in on those and see how Zeke's yards gained are effected by the number of defenders in the box. A good data science practice is to predict what you expect to see before completing the task so you can get an idea of if you did it correctly or if something went wrong. This is one reason why I love to analyze football because it is a passion of mine and is easy to answer questions like: will Zeke gain more yards with 6, 7, or 8 defenders in the box. This is an easy one to answer since more defenders the harder it is to break past the line of scrimmage.
I am going to create a simple histogram with 3 different portions, one with each of the different defenders in the box. Let's see what the plot looks like.
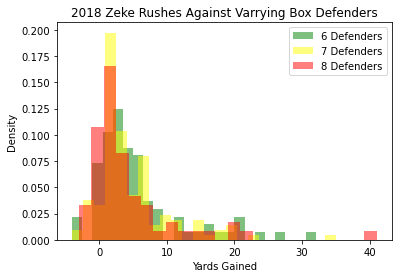
It actually isn't as big of a difference as I expected, but we do see the 8 defender data more to the left. This means that with 8 defenders in the box in 2018 Zeke was tackled for a loss around 10% of the time (estimate from the plot) while against 6 or 7 defenders he more often rushed between 0 - 10 yards.
I hope you enjoyed this post as we got a taste of NFL Next Gen Stats. In the future I would like to explore the movement data or any other analyses that may be interesting to you guys. So if you have any feedback or questions, as always feel free to ask.
Thanks for reading, see you next time!